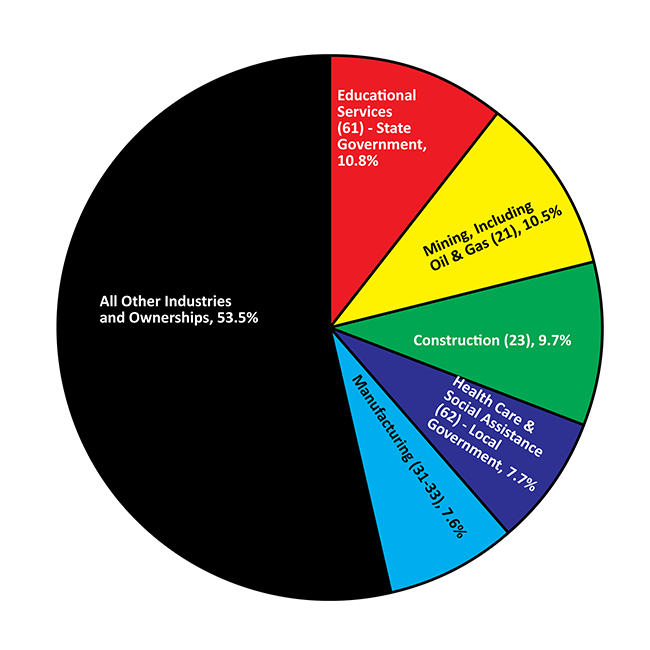
| Table 6: Wyoming Covered Employment, Total Wages, & Average Weekly Wage by Industry (NAICS) for Big Horn County - Third Quarter 2021a |
|
|
|
|
|
|
|
|
|
|
|
|
|
|
|
|
Average Monthly Employment |
Total Wages |
Average Weekly Wage |
|
|
|
Change |
|
Change |
|
Change |
| NAICSb Code |
Ownership and Industry |
2021Q3 |
2020Q3 |
N |
% |
2021Q3 |
2020Q3 |
$ |
% |
2021Q3 |
2020Q3 |
$ |
% |
| 0 |
Ownership - Total |
4,198 |
4,227 |
-30 |
-0.7 |
$45,361,496 |
$43,670,834 |
$1,690,662 |
3.9 |
$831 |
$795 |
$37 |
4.6 |
| 0 |
Ownership - Private |
2,825 |
2,825 |
0 |
0.0 |
$30,244,973 |
$28,923,498 |
$1,321,475 |
4.6 |
$823 |
$788 |
$36 |
4.6 |
| 11 |
Agriculture, Forestry, Fishing & Hunting |
154 |
175 |
-21 |
-12.0 |
$1,221,041 |
$1,223,684 |
-$2,643 |
-0.2 |
$610 |
$538 |
$72 |
13.4 |
| 111 |
Crop Production |
113 |
128 |
-16 |
-12.2 |
$989,726 |
$1,011,069 |
-$21,343 |
-2.1 |
$676 |
$606 |
$70 |
11.5 |
| 112 |
Animal Production & Aquaculture |
34 |
32 |
2 |
5.2 |
$174,016 |
$149,942 |
$24,074 |
16.1 |
$398 |
$360 |
$37 |
10.3 |
| 21 |
Mining, Quarrying, & Oil & Gas Extraction |
443 |
442 |
1 |
0.2 |
$6,571,315 |
$6,315,833 |
$255,482 |
4.0 |
$1,142 |
$1,099 |
$43 |
3.9 |
| 212 |
Mining, Except Oil & Gas |
438 |
438 |
0 |
0.0 |
$6,488,962 |
$6,243,493 |
$245,469 |
3.9 |
$1,140 |
$1,097 |
$43 |
3.9 |
| 22 |
Utilities |
32 |
31 |
1 |
3.2 |
$502,327 |
$457,585 |
$44,742 |
9.8 |
$1,195 |
$1,123 |
$72 |
6.4 |
| 221 |
Utilities |
32 |
31 |
1 |
3.2 |
$502,327 |
$457,585 |
$44,742 |
9.8 |
$1,195 |
$1,123 |
$72 |
6.4 |
| 23 |
Construction |
409 |
436 |
-27 |
-6.2 |
$5,207,281 |
$5,733,339 |
-$526,058 |
-9.2 |
$979 |
$1,012 |
-$32 |
-3.2 |
| 236 |
Construction of Buildings |
39 |
44 |
-5 |
-11.4 |
$307,389 |
$274,517 |
$32,872 |
12.0 |
$606 |
$480 |
$126 |
26.3 |
| 237 |
Heavy & Civil Engineering Construction |
191 |
252 |
-61 |
-24.2 |
$3,114,193 |
$3,986,421 |
-$872,228 |
-21.9 |
$1,252 |
$1,215 |
$37 |
3.0 |
| 238 |
Specialty Trade Contractors |
179 |
140 |
39 |
27.9 |
$1,785,699 |
$1,472,401 |
$313,298 |
21.3 |
$769 |
$811 |
-$42 |
-5.2 |
| 31 |
Manufacturing |
318 |
297 |
21 |
7.1 |
$4,433,068 |
$4,104,468 |
$328,600 |
8.0 |
$1,071 |
$1,062 |
$9 |
0.9 |
| 311 |
Food Manufacturing |
127 |
109 |
18 |
16.9 |
$1,423,596 |
$1,231,727 |
$191,869 |
15.6 |
$862 |
$872 |
-$10 |
-1.1 |
| 321 |
Wood Product Manufacturing |
8 |
16 |
-8 |
-51.0 |
$85,438 |
$118,010 |
-$32,572 |
-27.6 |
$822 |
$556 |
$266 |
47.8 |
| 42 |
Wholesale Trade |
95 |
85 |
10 |
11.4 |
$1,146,389 |
$1,013,567 |
$132,822 |
13.1 |
$931 |
$917 |
$14 |
1.6 |
| 424 |
Merchant Wholesalers, Nondurable Goods |
70 |
59 |
11 |
18.1 |
$767,340 |
$643,046 |
$124,294 |
19.3 |
$847 |
$838 |
$9 |
1.1 |
| 44 |
Retail Trade |
261 |
263 |
-2 |
-0.8 |
$1,631,048 |
$1,507,093 |
$123,955 |
8.2 |
$481 |
$441 |
$40 |
9.1 |
| 441 |
Motor Vehicle & Parts Dealers |
21 |
21 |
0 |
0.0 |
$157,456 |
$162,426 |
-$4,970 |
-3.1 |
$568 |
$586 |
-$18 |
-3.1 |
| 444 |
Building Material & Garden Supply Stores |
18 |
20 |
-2 |
-8.4 |
$102,941 |
$118,892 |
-$15,951 |
-13.4 |
$432 |
$457 |
-$25 |
-5.5 |
| 445 |
Food & Beverage Stores |
75 |
76 |
-1 |
-1.8 |
$468,187 |
$451,729 |
$16,458 |
3.6 |
$482 |
$457 |
$25 |
5.5 |
| 446 |
Health & Personal Care Stores |
24 |
29 |
-5 |
-17.2 |
$133,244 |
$148,745 |
-$15,501 |
-10.4 |
$427 |
$395 |
$33 |
8.2 |
| 447 |
Gasoline Stations |
86 |
82 |
4 |
5.3 |
$480,570 |
$397,583 |
$82,987 |
20.9 |
$428 |
$373 |
$55 |
14.8 |
| 48 |
Transportation & Warehousing |
58 |
38 |
20 |
54.0 |
$671,592 |
$317,936 |
$353,656 |
111.2 |
$891 |
$649 |
$241 |
37.2 |
| 484 |
Truck Transportation |
48 |
26 |
22 |
82.3 |
$624,348 |
$241,758 |
$382,590 |
158.3 |
$1,001 |
$706 |
$294 |
41.7 |
| 51 |
Information |
67 |
70 |
-3 |
-4.8 |
$633,274 |
$656,380 |
-$23,106 |
-3.5 |
$731 |
$721 |
$9 |
1.3 |
| 52 |
Finance & Insurance |
118 |
127 |
-8 |
-6.6 |
$1,401,127 |
$1,492,472 |
-$91,345 |
-6.1 |
$911 |
$906 |
$4 |
0.5 |
| 522 |
Credit Intermediation & Related Activities |
101 |
105 |
-3 |
-3.2 |
$1,183,644 |
$1,181,970 |
$1,674 |
0.1 |
$899 |
$869 |
$30 |
3.4 |
| 524 |
Insurance Carriers & Related Activities |
17 |
22 |
-5 |
-22.7 |
$217,423 |
$310,502 |
-$93,079 |
-30.0 |
$984 |
$1,086 |
-$102 |
-9.4 |
| 53 |
Real Estate & Rental & Leasing |
14 |
17 |
-3 |
-16.0 |
$82,193 |
$92,879 |
-$10,686 |
-11.5 |
$452 |
$429 |
$23 |
5.4 |
| 54 |
Professional & Technical Services |
84 |
74 |
9 |
12.6 |
$985,183 |
$816,926 |
$168,257 |
20.6 |
$906 |
$845 |
$60 |
7.1 |
| 541 |
Professional & Technical Services |
84 |
74 |
9 |
12.6 |
$985,183 |
$816,926 |
$168,257 |
20.6 |
$906 |
$845 |
$60 |
7.1 |
| 56 |
Administrative & Waste Services |
186 |
225 |
-39 |
-17.2 |
$2,082,500 |
$2,019,737 |
$62,763 |
3.1 |
$861 |
$692 |
$170 |
24.5 |
| 62 |
Health Care & Social Assistance |
187 |
174 |
13 |
7.7 |
$1,341,241 |
$1,209,296 |
$131,945 |
10.9 |
$551 |
$535 |
$16 |
3.0 |
| 624 |
Social Assistance |
98 |
90 |
9 |
9.7 |
$547,107 |
$487,972 |
$59,135 |
12.1 |
$428 |
$419 |
$9 |
2.2 |
| 71 |
Arts, Entertainment, & Recreation |
27 |
26 |
1 |
3.8 |
$179,315 |
$75,380 |
$103,935 |
137.9 |
$505 |
$220 |
$284 |
129.2 |
| 713 |
Amusements, Gambling, & Recreation |
27 |
26 |
1 |
3.8 |
$179,315 |
$75,380 |
$103,935 |
137.9 |
$505 |
$220 |
$284 |
129.2 |
| 72 |
Accommodation & Food Services |
285 |
257 |
28 |
10.9 |
$1,189,888 |
$1,011,008 |
$178,880 |
17.7 |
$321 |
$303 |
$19 |
6.1 |
| 721 |
Accommodation |
126 |
92 |
35 |
37.8 |
$684,008 |
$499,057 |
$184,951 |
37.1 |
$416 |
$419 |
-$2 |
-0.5 |
| 722 |
Food Services & Drinking Places |
159 |
165 |
-7 |
-4.0 |
$505,880 |
$511,951 |
-$6,071 |
-1.2 |
$245 |
$238 |
$7 |
3.0 |
| 81 |
Other Services, Except Public Administration |
39 |
46 |
-6 |
-13.9 |
$358,055 |
$374,480 |
-$16,425 |
-4.4 |
$700 |
$631 |
$70 |
11.0 |
| 811 |
Repair & Maintenance |
23 |
30 |
-7 |
-23.1 |
$246,160 |
$265,978 |
-$19,818 |
-7.5 |
$812 |
$675 |
$137 |
20.3 |
|
|
|
|
|
|
|
|
|
|
|
|
|
|
| 0 |
Ownership - Federal Government |
112 |
123 |
-11 |
-8.7 |
$2,149,407 |
$1,914,485 |
$234,922 |
12.3 |
$1,472 |
$1,197 |
$275 |
22.9 |
| 48 |
Transportation & Warehousing |
26 |
26 |
0 |
0.0 |
$255,024 |
$258,945 |
-$3,921 |
-1.5 |
$764 |
$776 |
-$12 |
-1.5 |
| 491 |
Postal Service |
26 |
26 |
0 |
0.0 |
$255,024 |
$258,945 |
-$3,921 |
-1.5 |
$764 |
$776 |
-$12 |
-1.5 |
| 71 |
Arts, Entertainment, & Recreation |
28 |
30 |
-2 |
-6.7 |
$442,976 |
$449,051 |
-$6,075 |
-1.4 |
$1,217 |
$1,151 |
$66 |
5.7 |
| 712 |
Museums, Historical Sites, Zoos, & Parks |
28 |
30 |
-2 |
-6.7 |
$442,976 |
$449,051 |
-$6,075 |
-1.4 |
$1,217 |
$1,151 |
$66 |
5.7 |
| 92 |
Public Administration |
59 |
67 |
-9 |
-12.9 |
$1,451,407 |
$1,206,489 |
$244,918 |
20.3 |
$1,903 |
$1,378 |
$525 |
38.1 |
| 924 |
Administration of Environmental Programs |
49 |
50 |
-1 |
-2.0 |
$1,302,893 |
$1,038,502 |
$264,391 |
25.5 |
$2,059 |
$1,608 |
$451 |
28.0 |
| 926 |
Administration of Economic Programs |
6 |
12 |
-7 |
-54.0 |
$64,439 |
$86,131 |
-$21,692 |
-25.2 |
$874 |
$537 |
$337 |
62.7 |
| 928 |
National Security & International Affairs |
4 |
5 |
-1 |
-18.8 |
$84,075 |
$81,856 |
$2,219 |
2.7 |
$1,494 |
$1,181 |
$312 |
26.4 |
|
|
|
|
|
|
|
|
|
|
|
|
|
|
| 0 |
Ownership - State Government |
162 |
169 |
-7 |
-4.1 |
$1,867,225 |
$2,089,570 |
-$222,345 |
-10.6 |
$887 |
$951 |
-$64 |
-6.8 |
| 61 |
Educational Services |
3 |
3 |
0 |
0.0 |
$27,813 |
$27,002 |
$811 |
3.0 |
$713 |
$692 |
$21 |
3.0 |
| 611 |
Educational Services |
3 |
3 |
0 |
0.0 |
$27,813 |
$27,002 |
$811 |
3.0 |
$713 |
$692 |
$21 |
3.0 |
| 62 |
Health Care & Social Assistance |
69 |
80 |
-11 |
-13.7 |
$709,183 |
$971,093 |
-$261,910 |
-27.0 |
$787 |
$930 |
-$143 |
-15.4 |
| 623 |
Nursing & Residential Care Facilities |
69 |
80 |
-11 |
-13.7 |
$709,183 |
$971,093 |
-$261,910 |
-27.0 |
$787 |
$930 |
-$143 |
-15.4 |
| 92 |
Public Administration |
90 |
86 |
4 |
4.7 |
$1,130,229 |
$1,091,475 |
$38,754 |
3.6 |
$970 |
$980 |
-$10 |
-1.1 |
| 922 |
Justice, Public Order, & Safety Activities |
3 |
3 |
0 |
0.0 |
$33,307 |
$33,272 |
$35 |
0.1 |
$854 |
$853 |
$1 |
0.1 |
| 923 |
Administration of Human Resource Programs |
8 |
8 |
0 |
0.0 |
$92,947 |
$90,751 |
$2,196 |
2.4 |
$894 |
$873 |
$21 |
2.4 |
| 924 |
Administration of Environmental Programs |
9 |
7 |
2 |
27.3 |
$118,227 |
$103,943 |
$14,284 |
13.7 |
$975 |
$1,091 |
-$116 |
-10.6 |
| 926 |
Administration of Economic Programs |
66 |
66 |
0 |
0.0 |
$852,327 |
$860,839 |
-$8,512 |
-1.0 |
$988 |
$998 |
-$10 |
-1.0 |
|
|
|
|
|
|
|
|
|
|
|
|
|
|
| 0 |
Ownership - Local Government |
1,098 |
1,110 |
-12 |
-1.1 |
$11,099,891 |
$10,743,281 |
$356,610 |
3.3 |
$778 |
$744 |
$33 |
4.5 |
| 61 |
Educational Services |
455 |
452 |
3 |
0.7 |
$4,348,377 |
$4,172,137 |
$176,240 |
4.2 |
$735 |
$710 |
$25 |
3.5 |
| 611 |
Educational Services |
455 |
452 |
3 |
0.7 |
$4,348,377 |
$4,172,137 |
$176,240 |
4.2 |
$735 |
$710 |
$25 |
3.5 |
| 62 |
Health Care & Social Assistance |
325 |
349 |
-24 |
-7.0 |
$4,480,498 |
$4,282,850 |
$197,648 |
4.6 |
$1,060 |
$943 |
$117 |
12.4 |
| 92 |
Public Administration |
270 |
259 |
11 |
4.2 |
$2,048,607 |
$2,091,125 |
-$42,518 |
-2.0 |
$583 |
$620 |
-$37 |
-6.0 |
| 921 |
Executive, Legislative & General Government |
241 |
236 |
5 |
2.0 |
$1,935,107 |
$1,983,576 |
-$48,469 |
-2.4 |
$618 |
$647 |
-$28 |
-4.3 |
|
|
|
|
|
|
|
|
|
|
|
|
|
|
| aPreliminary. |
| bNorth American Industry Classification System. |
| Source: Quarterly Census of Employment and Wages, developed through a cooperative program between Research & Planning and the U.S. Bureau of Labor Statistics. |
| Extract Date: January 2022. |
| Prepared by M. Moore, Research & Planning, WY DWS, 1/10/22. |


 Wyoming at Work