Economic Indicators
by: Margaret Hiatt, Administrative/Survey Support Specialist
Wyoming's Unemployment Insurance benefits paid fell by 25.2% from November 2009 to November 2010.
|
|
|
|
Nov |
Oct |
Nov |
Percent Change |
|
|
|
|
2010 |
2010 |
2009 |
Month |
Year |
|
|
|
|
______(p)_ |
______(r)_ |
_____(b)_ |
_____ |
_____ |
| Wyoming Total Civilian Labor Force1 |
|
292,643 |
292,865 |
292,609 |
-0.1 |
0.0 |
|
|
Unemployed |
|
18,618 |
17,817 |
21,160 |
4.5 |
-12.0 |
|
|
Employed |
|
274,025 |
275,048 |
271,449 |
-0.4 |
0.9 |
| Wyoming Unemployment Rate/Seas. Adj. |
|
6.4%/6.6% |
6.1%/6.7% |
7.2%/7.5% |
N/A |
N/A |
| U.S. Unemployment Rate/Seas. Adj. |
|
9.3%/9.8% |
9.0%/9.6% |
9.4%/10.0% |
N/A |
N/A |
| U.S. Multiple Jobholders |
|
6,816,000 |
6,817,000 |
7,222,000 |
0.0 |
-5.6 |
|
As a percent of all workers |
|
4.9% |
4.9% |
5.2% |
N/A |
N/A |
| U.S. Discouraged Workers |
|
1,282,000 |
1,219,000 |
861,000 |
5.2 |
48.9 |
| U.S. Part Time for Economic Reasons |
|
8,670,000 |
8,408,000 |
8,894,000 |
3.1 |
-2.5 |
|
|
|
|
|
|
|
|
|
| Hours & Earnings for Production Workers |
| Wyoming Manufacturing Hours & Earnings |
|
|
|
|
|
|
|
Average Weekly Earnings |
|
$849.96 |
$838.45 |
$861.08 |
1.4 |
-1.3 |
|
Average Weekly Hours |
|
41.2 |
40.9 |
41.8 |
0.7 |
-1.4 |
| U.S. Manufacturing Hours & Earnings |
|
|
|
|
|
|
|
Average Weekly Earnings |
|
$780.21 |
$775.22 |
$750.31 |
0.6 |
4.0 |
|
Average Weekly Hours |
|
41.7 |
41.5 |
40.8 |
0.5 |
2.2 |
|
|
|
|
|
|
|
|
|
| Wyoming
Unemployment Insurance |
|
Weeks Compensated 2 |
|
28,656 |
18,743 |
34,971 |
52.9 |
-18.1 |
|
Benefits Paid |
|
$8,793,196 |
$5,957,806 |
$11,749,825 |
47.6 |
-25.2 |
|
Average Weekly Benefit Payment |
|
$306.85 |
$317.87 |
$335.99 |
-3.5 |
-8.7 |
|
State Insured Covered Jobs (1) |
|
262,568 |
266,549 |
260,399 |
-1.5 |
0.8 |
|
Insured Unemployment Rate |
|
2.3% |
2.1% |
2.8% |
N/A |
N/A |
|
|
|
|
|
|
|
|
|
| Consumer Price Index (U) for All U.S. Urban
Consumers |
| (1982 to 1984 = 100) |
|
|
|
|
|
|
|
All Items |
|
218.8 |
218.7 |
216.3 |
0.0 |
1.1 |
|
|
Food & Beverages |
|
221.0 |
221.0 |
217.7 |
0.0 |
1.5 |
|
|
Housing |
|
215.8 |
216.1 |
215.8 |
-0.1 |
0.0 |
|
|
Apparel |
|
121.5 |
122.5 |
122.5 |
-0.8 |
-0.8 |
|
|
Transportation |
|
195.7 |
194.3 |
188.6 |
0.7 |
3.7 |
|
|
Medical Care |
|
391.7 |
391.2 |
379.6 |
0.1 |
3.2 |
|
|
Recreation (Dec. 1997=100) |
|
112.8 |
113.0 |
113.8 |
-0.1 |
-0.9 |
|
|
Education & Communication (Dec. 1997=100) |
|
130.9 |
131.0 |
128.8 |
0.0 |
1.6 |
|
|
Other Goods & Services |
|
383.6 |
382.8 |
376.7 |
0.2 |
1.8 |
|
|
|
|
|
|
|
|
|
| Producer Prices (1982 to 1984 = 100) |
|
All Commodities |
|
188.0 |
186.8 |
177.4 |
0.6 |
6.0 |
|
|
|
|
|
|
|
|
|
| Wyoming Building Permits (New Privately Owned
Housing Units Authorized) |
|
Total Units |
|
186 |
218 |
86 |
-14.7 |
116.3 |
|
|
Valuation |
|
$27,055,000 |
$45,881,000 |
$22,811,000 |
-41.0 |
18.6 |
|
Single Family Homes |
|
67 |
190 |
86 |
-64.7 |
-22.1 |
|
|
Valuation |
|
$16,773,000 |
$43,628,000 |
$22,811,000 |
-61.6 |
-26.5 |
|
Casper MSA2 Building Permits |
|
67 |
13 |
11 |
415.4 |
509.1 |
|
|
Valuation |
|
$7,068,000 |
$4,590,000 |
$3,702,000 |
54.0 |
90.9 |
|
Cheyenne MSA Building Permits |
|
31 |
30 |
8 |
3.3 |
287.5 |
|
|
Valuation |
|
$3,345,000 |
$3,435,000 |
$2,527,000 |
-2.6 |
32.4 |
|
|
|
|
|
|
|
|
|
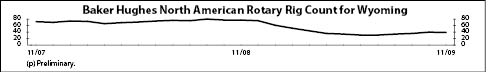
| Baker Hughes North American Rotary Rig Count
for Wyoming |
|
44 |
44 |
39 |
0.0 |
12.8 |
|
|
|
|
|
|
|
|
|
|
|
|
|
|
|
|
|
|
(p) Preliminary. (r) Revised.
1 Local Area
Unemployment Statistics Program estimates. |
|
|
|
| 2 Metropolitan Statistical Area. |
|
|
|
|
|
|