Detailed Covered Employment and Wages for Second Quarter 2010: Growth in Total Payroll Resumes
Although total payroll ($25,283,451, or 0.9%) and average weekly wage ($21, or 2.7%) increased from second quarter 2009 to second quarter 2010, average monthly employment decreased (-5,209, or -1.9%) during the same period.
After five consecutive quarters of decreasing, total unemployment insurance (UI) covered payroll increased by $25.3 million (0.9%) in second quarter 2010. UI covered payroll represents approximately 92% of all wage and salary disbursements and 45% of personal income in the state (U.S. Bureau of Economic Analysis, 2007). Total payroll increased in 17 of the state's 23 counties. Although employment, payroll, and average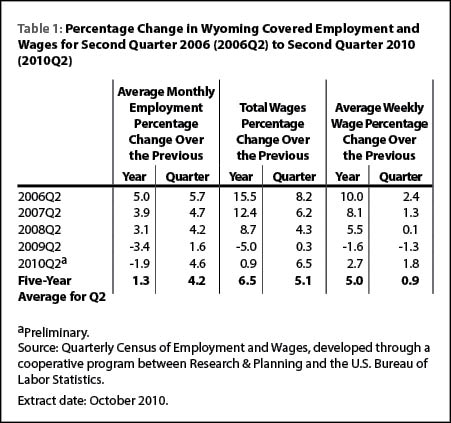 weekly wage all grew at rates substantially lower than their five-year averages, they exhibited much higher growth than in second quarter 2009 (see Table 1). Total payroll is an important economic indicator because it is often associated with consumer spending, retail sales, and sales tax revenue (Black & Evans, 1997).
The covered payroll and employment data in this article are tabulated by place of work, in contrast to the labor force estimates which are a measure of employed and unemployed persons by place of residence. Also, the employment data presented in this article represent a count of jobs, not persons. When individuals work more than one job, each is counted separately. Finally, job growth (or decline) is stated in terms of net change. The Quarterly Turnover Statistics by Industry table presents alternative measures of job gains and losses.
The purpose of this article is to show employment and payroll changes between second quarter 2009 and second quarter 2010. These economic changes help gauge the overall strength of Wyoming's economy and identify the fastest and slowest growing sectors and geographic areas.
The Figure shows that job losses slowed from 4.7% in first quarter to  1.9% in second quarter of 2010. Growth in total payroll, which had declined steeply during 2009, rebounded to positive territory in second quarter 2010 (see Table 2).
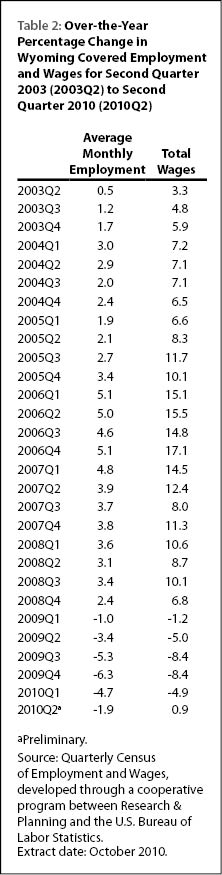
Employment and Wages by County
As can be seen in Table 3, employment increased in 10 counties and 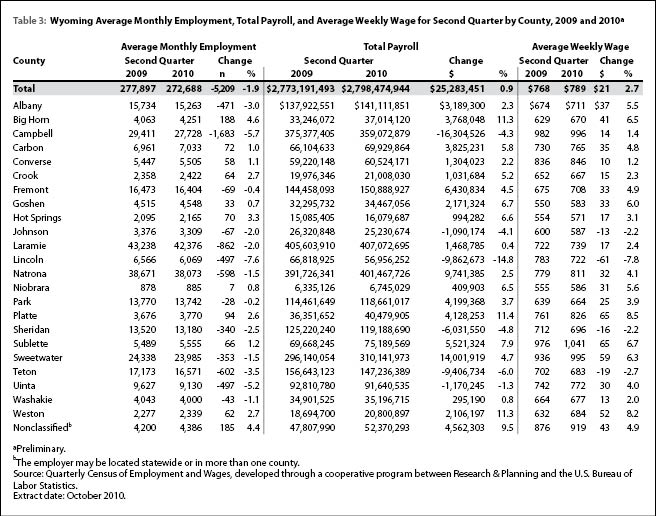 decreased in 13 counties. Most of the employment increases were modest compared to the job losses, leaving an overall net decrease of 5,209 jobs (-1.9%).
Big Horn County added 188 jobs (4.6%) and its total payroll increased by $3.8 million (11.3%). Mining gained nearly 100 jobs, and smaller increases were seen in local government, administrative & waste services, manufacturing, transportation & warehousing, and professional & technical services.
Platte County gained 94 jobs (2.6%) and its total payroll increased by $4.1 million (11.4%). Small job gains were seen in local and federal government.
Carbon County's employment increased by 72 jobs (1.0%) and its total payroll rose by $3.8 million (5.8%). Construction posted the largest job gains (approximately 250 jobs), followed by health care & social assistance (more than 50 jobs). Employment decreased in local government, retail trade, accommodation & food services, professional & technical services, state government, and administrative & waste services.
Hot Springs County added 70 jobs (3.3%) and its total payroll increased by $1.0 million (6.6%). Modest job gains were seen in mining and retail trade.
Sublette County's employment increased by 66 jobs (1.2%) and its total payroll grew by $5.5 million (7.9%). Job losses in mining (including oil & gas; approximately 150 jobs) were more than offset by job gains in construction (more than 300 jobs) and local government.
Campbell County lost more jobs than any other county (-1,683 jobs, or -5.7%) and its total payroll fell by $16.3 million (-4.3%). Construction employment fell by nearly 800 jobs, administrative & waste services lost approximately 200 jobs, and mining (including oil & gas) lost approximately 200 jobs. Large job losses were also seen in accommodation & food services, wholesale trade, and retail trade.
Teton County's employment fell by 602 jobs (-3.5%) and its total payroll decreased by $9.4 million (-6.0%). By far, the largest job losses were in construction (more than 550 jobs). Employment also decreased in retail trade, finance & insurance, and administrative & waste services. In contrast to the statewide trend, employment increased in accommodation & food services (nearly 200 jobs).
Lincoln County lost 497 jobs (-7.6%) and its total payroll fell by $9.9 million (-14.8%). Large job losses were seen in construction (more than 300 jobs) and retail trade (more than 100 jobs).
Employment in Uinta County fell by 497 jobs (-5.2%) and total payroll decreased by $1.2 million (-1.3%). Retail trade, mining, and accommodation & food services each lost more than 100 jobs.
Albany County's employment decreased by 471 jobs (-3.0%) but its total payroll increased by $3.2 million (2.3%). Construction, state government, and administrative & waste services each lost more than 100 jobs.
Table 4 shows that Natrona County lost 598 jobs (-1.5%), but its total 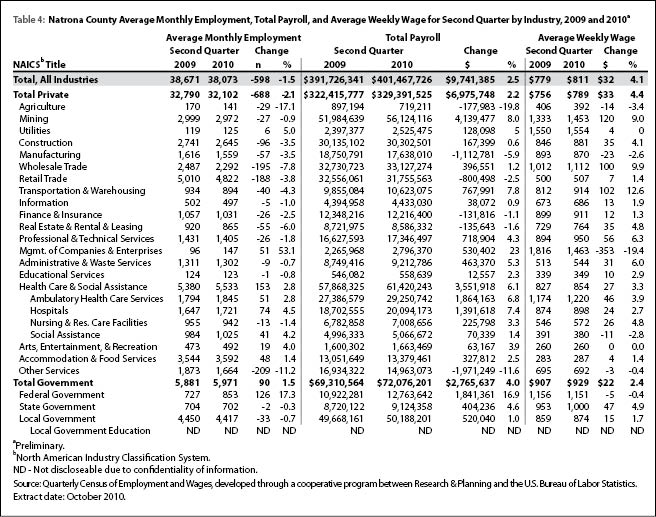 payroll grew by $9.7 million (2.5%). The largest job losses occurred in other services (-209 jobs, or -11.2%), wholesale trade (-195 jobs, or -7.8%), retail trade (-188 jobs, or -3.8%), construction (-96 jobs, or -3.5%), and manufacturing (-57 jobs, or -3.5%). Notable job gains were seen in health care & social assistance (153 jobs, or 2.8%) and federal government (126 jobs, or 17.3%).
Laramie County's employment fell by 862 jobs (-2.0%) but its total payroll 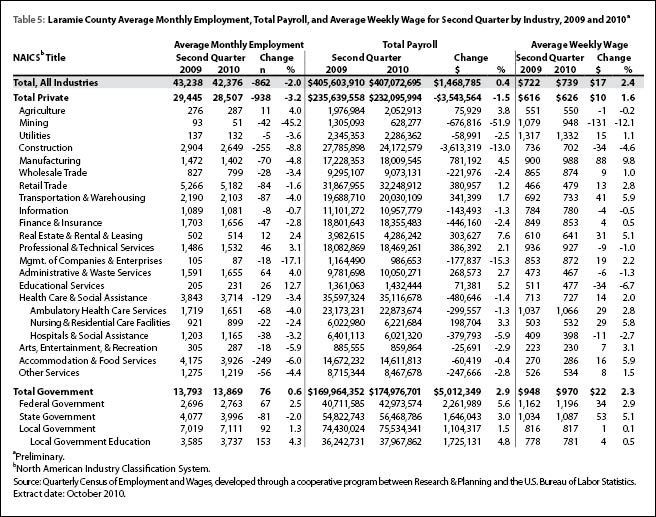 increased by $1.5 million (0.4%; see Table 5). Employment fell in construction (-255 jobs, or -8.8%), accommodation & food services (-249 jobs, or -6.0%), and health care & social assistance (-129 jobs, or -3.4%).Job gains occurred in local government (92 jobs, or 1.3%), federal government (67 jobs, or 2.5%), and administrative & waste services (64 jobs, or 4.0%).
Statewide Employment and Wages by Industry
Table 6 shows that government and health care dominated 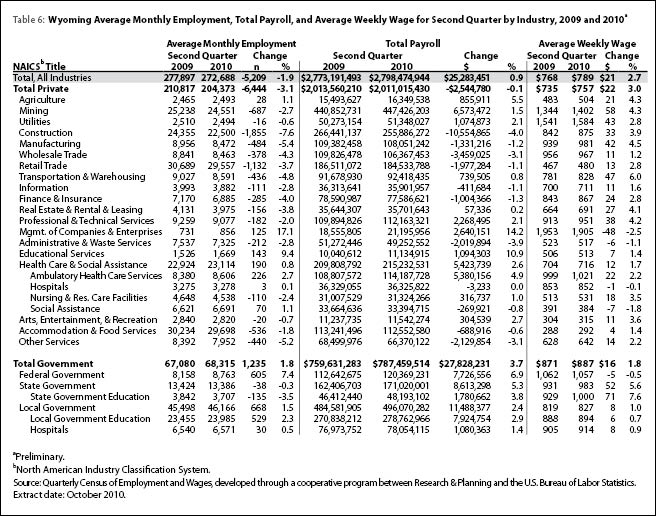 job gains in second quarter. Job losses continued in construction, retail trade, mining, and accommodation & food services. Total payroll in government rose by $27.8 million (3.7%), while total private payroll decreased slightly (-$2.5 million, or -0.1%).
Local government added 668 jobs (1.5%) and its total payroll rose by $11.5 million (2.4%). A large part of the growth in jobs was accounted for by local government education (including public schools and colleges; 529 jobs, or 2.3%).
Federal government employment increased by 605 jobs (7.4%) and total payroll grew by $7.7 million (6.9%). At least part of the increased employment was the result of the U.S. Census Bureau hiring temporary workers to conduct the decennial census.
Health care & social assistance added 190 jobs (0.8%) and its total payroll rose by $5.4 million (2.6%). Employment increased in ambulatory health care services (226 jobs, or 2.7%) and social assistance (70 jobs, or 1.1%), but decreased in nursing & residential care facilities (-110 jobs, or -2.4%).
Employment in private educational services increased by 143 jobs (9.4%) and its total payroll grew by $1.1 million (10.9%). Small job gains were seen in private elementary & secondary schools, colleges & universities, technical & trade schools, other schools & instruction, and educational support services.
Management of companies & enterprises added 125 jobs (17.1%) and its payroll rose by $2.6 million (14.2%). The majority of job gains occurred in corporate, subsidiary, & regional managing offices.
Construction employment fell by 1,855 jobs (-7.6%) and its total payroll decreased by $10.6 million (-4.0%). Job losses were seen in construction of buildings (approximately 700 jobs), heavy & civil engineering construction (approximately 400 jobs), and specialty trade contractors (more than 700 jobs).
Employment in retail trade decreased by 1,132 jobs (-3.7%) and its total payroll fell by $2.0 million (-1.1%). The largest job losses occurred in general merchandise stores (more than 300 jobs), gasoline stations (more than 200 jobs), motor vehicle & parts dealers (nearly 200 jobs), food & beverage stores (approximately 150 jobs), and miscellaneous store retailers (more than 100 jobs). Smaller job losses were seen in furniture & home furnishings stores, building material & garden supply stores, health & personal care stores, and nonstore retailers.
Mining employment fell by 687 jobs (-2.7%), but its total payroll rose by $6.6 million (1.5%). Oil & gas extraction added nearly 150 jobs, but mining, except oil & gas lost more than 100 jobs and support activities for mining lost approximately 700 jobs.
Accommodation & food services lost 536 jobs (-1.8%) and its total payroll decreased by $0.7 million (-0.6%). Employment in food services & drinking places fell by more than 400 jobs and employment in accommodation decreased by approximately 100 jobs.
Manufacturing employment decreased by 484 jobs (-5.4%) and its total payroll fell by $1.3 million (-1.2%). The largest job losses occurred in fabricated metal product manufacturing (more than 150 jobs) and miscellaneous manufacturing (approximately 100 jobs). Smaller job losses were seen in wood product manufacturing, computer & electronic product manufacturing, and petroleum & coal products manufacturing. Employment increased slightly in chemical manufacturing and transportation equipment manufacturing.
Employment in other services fell by 440 jobs (-5.2%) and its total payroll decreased by $2.1 million (-3.1%). Repair & maintenance services lost more than 300 jobs and personal & laundry services lost more than 100 jobs. Employment remained stable in membership associations & organizations.
In summary, although employment remained below year-ago levels in second quarter, total payroll and average weekly wage increased. Job losses were smaller than in the prior four quarters. It appears that Wyoming's economy was beginning to stabilize in second quarter and may be poised for modest growth in the coming months.
Senior Economist David Bullard can be reached at (307) 473-3810 or dbulla@state.wy.us.
References
Black, D. & Evans, M. (1997, May). Work, pay and consumer spending, part one: Sales tax collections and total payroll. Wyoming Labor Force Trends, 34(5), Retrieved September 11, 2008, from http://doe.state.wy.us/LMI/0597/0597a2.htm
U.S. Bureau of Economic Analysis. (2007, May 15). SA04 State income and employment summary — Wyoming. Retrieved May 15, 2007, from http://www.bea.gov/regional/spi/default.cfm
U.S. Census Bureau. (2007, August 28). 2007 NAICS codes and titles. Retrieved September 20, 2007, from http://www.census.gov/naics/2007/NAICOD07.htm