Quarterly Benefits Analysis
Introduction
The landscape of employer-provided benefits is changing rapidly. Events such as the recent economic downturn and the passage of the Patient Protection and Affordable Care Act (2010) and the Health Care and Education Reconciliation Act (2010) will have impacts now and in years to come on the structure of compensation (e.g., the balance between direct wages and indirect compensation).
In prior years, estimates from the Wyoming Benefits Survey were published on an annual basis. These estimates allow a variety of interested parties to observe how benefits offerings and usage have changed over time. However, given the events described above, Research & Planning (R&P) began developing quarterly estimates in 2010.
The purpose of the current research is to demonstrate how more frequent estimates may indicate early trends and changes in benefits offerings and usage in Wyoming. This article marks the first quarterly publication of Benefits Survey results; the time span for data collection in this report was from 2009Q4 to 2010Q3.
Methodology
The methods used to develop the quarterly estimates are the same as those described in the most recent annual publication (Knapp, 2011). The only item that varies in the current analysis is the time span. Each set of estimates represents a four-quarter moving average of collected Benefits Survey data. For example, the most recent annual publication (Knapp, 2011) includes data collected from all four quarters of 2009. The next quarterly estimates period includes second, third, and 2009Q4, along with 2010Q1. This pattern repeats in subsequent quarters. To simplify reporting, this article will refer to each set of estimates by its most recent quarter of data collection. For example, the 2009 data will be referred to as 2009Q4, while the next set of quarterly estimates will be referred to as 2010Q1 and so forth.
Results
Response rates for each four-quarter analysis period held steady between 73.4% and 76.3%. Bear in mind that the estimates are a four-quarter moving average.
Table 1 displays the proportion of full-time employees 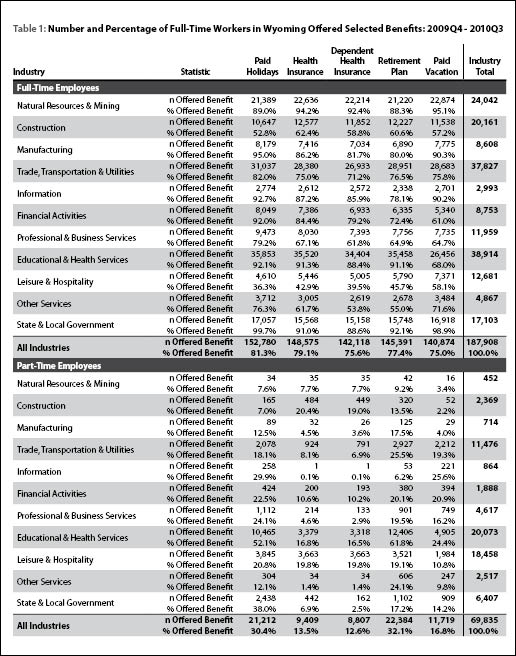 offered selected benefits for the 2010Q3 analysis period. Among all industries, 81.3% of full-time workers were offered paid holidays, while slightly lower offering percentages occurred with health insurance (79.1%), dependent health insurance (75.6%), retirement plans (77.4%), and paid vacation (75.0%). Full-time workers were the least likely to be offered the selected benefits in leisure & hospitality, where offering percentages ranged from 39.5% for dependent health insurance to 58.1% for paid vacation. The selected benefits were most likely to be offered in state & local government, where offering percentages ranged from 88.6% for dependent health insurance to 99.7% for paid holidays.
Offering proportions for part-time workers were considerably less than those for full-time workers. The percentages within all industries ranged from a high of 32.1% (retirement plan) to a low of 12.6% (dependent health insurance). Offering proportions at the industry level were not as clear for part-time workers as they were for full-time workers. Education & health services appeared to have the most consistent offerings to part-time workers, ranging from 16.5% (dependent health insurance) to 61.8% (retirement plan). Part-time workers in educational & health services were most likely to be offered paid holidays (52.1%) or a retirement plan (61.8%).
In order to demonstrate that the four quarters ending with 2010Q3 may 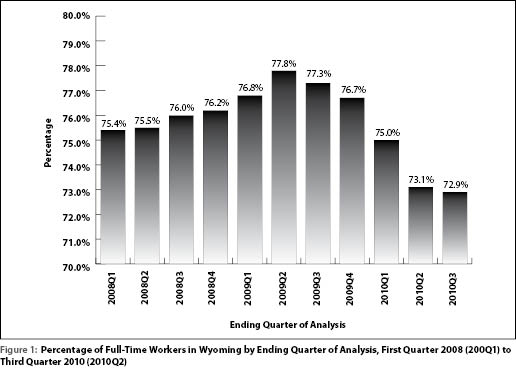 be a function of an economic downturn, Figure 1 illustrates the proportion of full-time employment in Wyoming for 11 quarters. The proportion of full-time workers in Wyoming increased from 75.4% in 2008Q1 to a peak of 77.8% in 2009Q2. The ratio then declined steadily to 76.7% in 2009Q4 and then to 72.9% in 2010Q3.
Although the proportion of full-time workers declined, the proportion of 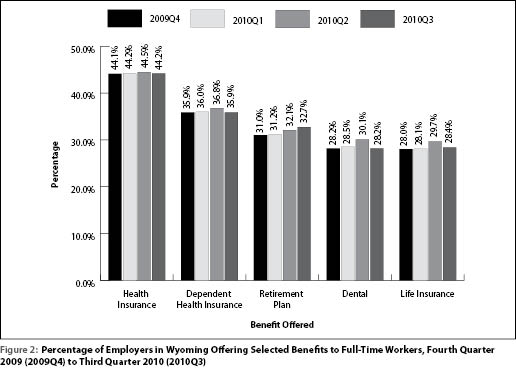 employers offering selected benefits to those workers is steady to slightly greater during the most recent quarters for which data are available (see Figure 2). The denominator in this figure is the number of employers or firms. Of particular interest is the proportion of employers offering retirement plans to full-time workers. This proportion increased steadily from 31.0% in 2009Q4 to 32.7% in 2010Q3. This change was not significant. In addition, since the data consist of discrete samples, the estimates are not a time series. An increasing number of employers offering this type of benefit to full-time workers may indicate a recovery in Wyoming's economy.
Figure 3 displays the proportion of full-time workers offered selected benefits. The denominator in Figure 3 is the estimated number of 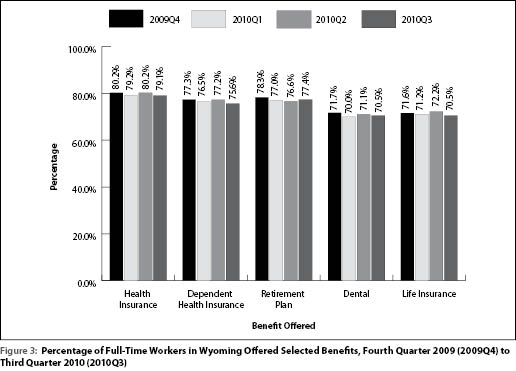 full-time workers. The proportion of full-time workers offered selected benefits generally declined over time by approximately 1.0% of full-time workers with the exception of retirement plans. The proportion of full-time workers offered a retirement plan increased from 76.6% in 2010Q2 to 77.4% in 2010Q3. This is not a significant change, but it can be monitored with the quarterly publication of benefits estimates. Although a greater percentage of full-time workers were offered health insurance than retirement plans in 2010Q3 (79.1% compared to 77.4%), the 2010Q3 proportion for health insurance was 1.1% less than the 2009Q4 result. A similar result occurred with the other selected benefits.
While the proportion of full-time workers offered selected benefits (except 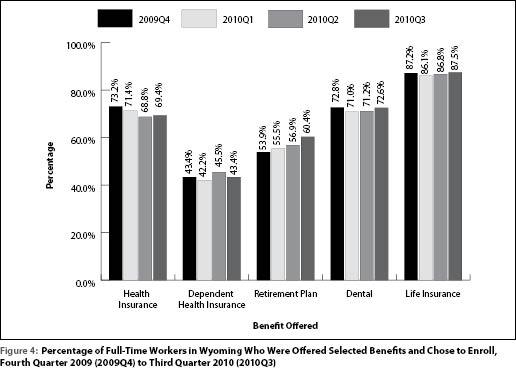 for retirement plans) generally declined, Figure 4 shows a somewhat different result with regard to take-up rates. Take-up rates are defined as the proportion of workers offered a benefit who enroll in a benefit. For each benefit except dependent health insurance, the take-up rates increased between 2010Q2 and 2010Q3. This was especially noticeable for retirement plans, where the take-up rate increased from 56.9% in 2010Q2 to 60.4% in 2010Q3 (change significant at p<.05). Not only were more employees offered these benefits, but they also were more likely to enroll in offered benefits. This may be indicative of improving economic conditions. As workers' incomes increase, they may be more likely to save a portion of their earnings in a retirement plan.
Conclusion
Monitoring results from the Wyoming Benefits Survey can provide insight into market responses to changes in law and economic events. While the effects of health care legislation have yet to substantially impact the results, the most recent downturn appears to have triggered responses from both employers and workers in regard to benefit choices. This was especially evident in the offering and take-up rates of full-time workers in regard to retirement plans. As more provisions of health care legislation take effect, expect to see further changes in survey results as well.
This article marks the first publication of quarterly estimates from the Wyoming Benefits Survey. Future articles will describe changes in the estimates to better understand trends in benefits offerings by Wyoming's employers.
References
Health Care and Education Reconciliation Act of 2010. Pub. L. no. 111-152.
Knapp, L. (2011). Wyoming Benefits Survey 2009. Working document.
Leonard, D. (2011). Wyoming Benefits Survey Quarterly Results. Unpublished data.
Patient Protection and Affordable Care Act of 2010. Pub. L. no. 111-148.