Calculation of Workers' Compensation Claims: A Methodological Note
The November 2010 issue of Wyoming Labor Force Trends included an article that listed initial and continued Workers' Compensation claims.
In this article, the definition of initial claims remains the same: An initial claim occurs in the quarter of injury when the claimant first files for workers' compensation.
The definition of a continued claim has been adjusted following re-analysis of the data. Previously, a continued claim was defined as one that remained in open status. After review, it was discovered that numerous claims remain in open status for years without any claimant activity. The revised definition of a continued claim is one that has any monetary activity in the quarter, either medical or compensation.
For example, assume a worker suffered a back injury in first quarter 2008 (2008Q1) and filed a workers' compensation claim. The worker received immediate medical treatment with no further treatment necessary at that time. There was no ongoing compensation paid to the worker, and he or she was able to resume employment with no impairment. The claim remained in open status in the workers' compensation database. Then in 2010Q2, the back injury became aggravated and required additional medical attention.
The majority of initial claims are medical only, meaning a claim is filed for medical expenses related to the workplace incident; there is no activity on the claim over long periods of time.
Continued claims are expected to be less volatile than initial claims in both incidence rates and percentage changes in number of claims. This is due to the nature of a continued claim, especially compensation claims. Compensation claims are paid a monetary amount for a designated period due to temporary or permanent disabilities, and therefore may be counted in many quarters.
The number of transactions is the total number of jobs by industry subsector (or in total) in a given quarter. The number of transactions differs from the number of people employed in an industry subsector because a particular person could hold more than one job in a quarter.
The Table includes three additional columns that were not included in 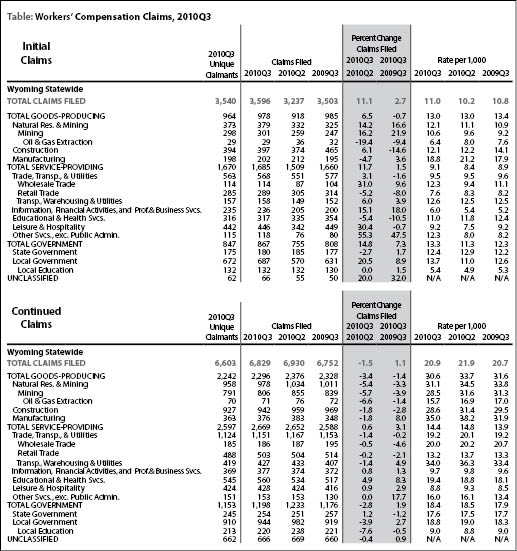 previous workers' compensation tables. The Table includes the rate of incidence, or the number of claims per 1,000 transactions.
For example, among all goods-producing industries in 2010Q3, there were 978 initial claims and 75,371 transactions (transactions are not shown in the Table). The rate of incidence is calculated by dividing the number of initial claims (978) by the number of transactions (75,371) and multiplying that number by 1,000. Therefore, the rate was 13 initial claims per 1,000 transactions.
The Table contains two percentage change columns that indicate over-the-year and over-the-quarter changes (see shaded area). For example, among all goods-producing industries, the number of initial claims increased by 6.5% over the quarter from 2010Q2 to 2010Q3, but decreased by 0.7% from 2009Q3 to 2010Q3.
These percentage change columns do not use the number of transactions as a denominator and therefore, may present a different representation (often showing more volatile changes) than the rate of incidence columns.
To illustrate the difference in calculations, it was demonstrated that the percentage change in all Goods-Producing claims was 6.5% from 2010Q2 to 2010Q3. However, 2010Q3 and 2010Q2, the incidence rates are the same at 13 claims per thousand transactions. The explanation for the lack of change in the incidence rates between the two time periods is that while there were 60 more claims in 2010Q3, the number of transactions increased such that the resulting incidence rates did not change.
The overall rate of initial workers' compensation claims was 11 claims per 1,000 transactions for 2010Q3. This rate stayed relatively constant over the quarters 2010Q3, 2010Q2, and 2009Q3. The manufacturing sector had the highest incidence rates over the three periods, with a rate of 19 claims per 1,000 transactions in 2010Q3. The lowest incidence rates over the three periods were in the Local Education subsector, with 5 claims per 1,000 for all three periods.
In terms of percentage changes, overall initial claims increased by 11.1% from 2010Q2 to 2010Q3. Natural Resources & Mining showed a 14.2% increase from the last quarter, but a subsector of that industry, Oil & Gas Extraction, showed a decrease of 19.4%.
As expected, there were no substantial changes in incidence rates or percentage changes in the number of continued claims. The number of claims in Oil & Gas Extraction decreased by 6.6% compared to the previous quarter, mirroring the decrease in initial claims. The incidence rates over the last year for each industry (and subsectors) have not changed substantially.
Historic tables can be found online at http://doe.state.wy.us/LMI/0111/a5_wc_tables.htm.