
Local Jobs and Payroll in Wyoming in Fourth Quarter 2013: Modest Job Growth Continues
|
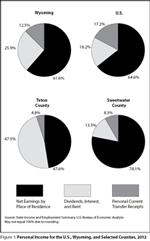
Total unemployment insurance (UI) covered payroll increased by $48.7 million (1.5%) in fourth quarter 2013. Employment rose by 1,507 jobs (0.5%) and average weekly wage increased by $8 (0.9%). In fourth quarter, employment grew faster than its five-year average (0.5% compared to -0.4%), total wages grew faster than their five-year average (1.5% compared to 1.1%), but average weekly wage grew slower than its five-year average (0.9% compared to 1.6%). Job losses in the mining sector (including oil & gas) were smaller than in third quarter (-409 jobs, or -1.5% compared to -729 jobs, or -2.7%). In terms of dollars, UI covered payroll represents approximately 91.5% of all wage and salary disbursements and 43.8% of personal income in the state (U.S. Bureau of Economic Analysis, 2014). Analysts have noted that “minerals related employment is one of the key predictors of sales and use tax revenue” in Wyoming (CREG 2010).
Despite the recent growth, overall employment remained approximately 7,000 jobs (2.4%) below its fourth quarter 2008 level. In short, the state has yet to make up all the job losses of 2009 and 2010.
Read Article Tables and Figures
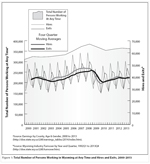
Total Wages, Average Monthly Employment, and Average Monthly Wage Changes for Wyoming by Year/Quarter: 2005Q1 to 2014Q1
Persons Working in Jobs Covered by Wyoming State Unemployment Insurance, First Quarter 2014
The mean quarterly wage for persons working one job in Wyoming increased from $10,787 in 2013Q1 to $11,150 in 2014Q1, an increase of 3.4%. Mean quarterly wages also increased from previous year levels for all others holding two or more jobs.
Quarterly Turnover Statistics by Industry, Fourth Quarter 2013
Training for What?
Using New Hires Survey Data to Identify Training Opportunities
|
Understanding the New Hires Survey Data Tables
Data collected through R&P’s New Hires Survey provide a rich level of detail not previously available from other surveys or administrative databases. This article showed just two of the many uses for these data that can benefit employers, educators, training providers, jobseekers, policymakers, and others. Full results from the New Hires Survey dating back to 2009Q4 can be found online here.
Read Article Tables and Figures
Wyoming Unemployment Rate at 3.8% in May 2014
|
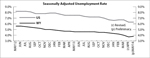
Wyoming’s seasonally adjusted unemployment rate rose slightly from 3.7% in April to 3.8% in May 2014 (not a statistically significant change). Wyoming’s unemployment rate remained much lower than its May 2013 level of 4.6%, and significantly lower than the current U.S. unemployment rate of 6.3%.
Explaining State-to-State Differences in Fatal Occupational Injury Rates
|
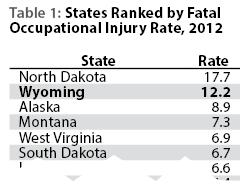
Nearly three-fourths of the difference in state fatal occupational injury rates can be explained by the proportion of total employment in each state that is found in production agriculture and mining. At the national level, these are the most dangerous sectors and they have a clear influence on state fatality rates. States that have a high percentage of employment in production agriculture and mining may have other similarities, and would probably benefit from working together to address workplace safety issues.
Read Article Tables and Figures