
Local Jobs and Payroll in Wyoming in Fourth Quarter 2013: Modest Job Growth Continues
(Tables and Figures)
Tables 1, 2, 3, 4, Natrona County, Laramie County
(note: Due to space considerations, tables for Natrona and Laramie County do not appear in the printed version of this issue of Trends.)
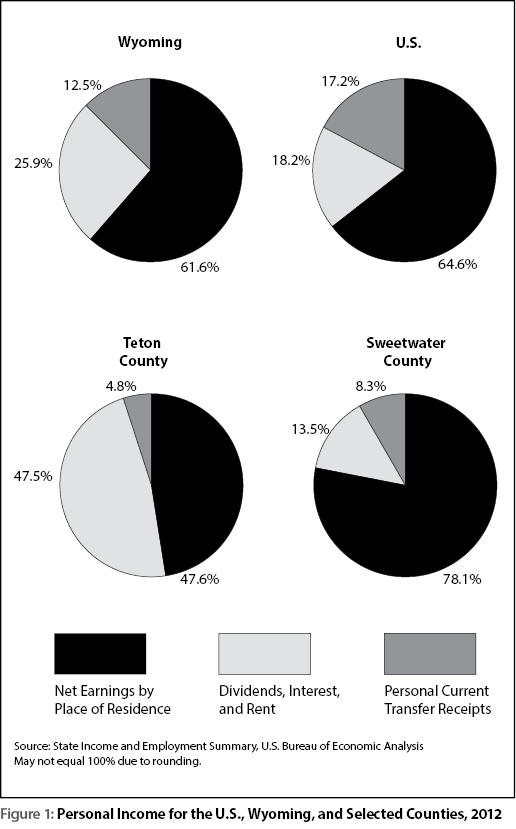
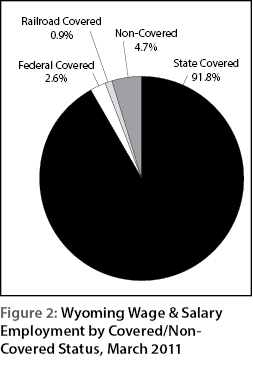
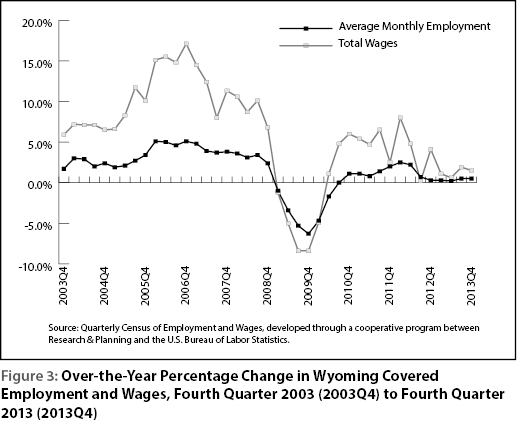
Figures 1, 2, 3
| Average Monthly Employment Percentage Change Over the Previous | Total Wages Percentage Change Over the Previous | Average Weekly Wage Percentage Change Over the Previous | ||||
|---|---|---|---|---|---|---|
| Year | Quarter | Year | Quarter | Year | Quarter | |
| aPreliminary.
Source: Quarterly Census of Employment and Wages, developed through a cooperative program between Research & Planning and the U.S. Bureau of Labor Statistics. Extract date: April 2014. |
||||||
| 2009Q4 | -6.3 | -3.2 | -8.4 | 6.4 | -2.2 | 9.9 |
| 2010Q4 | 1.1 | -2.1 | 6.0 | 7.7 | 4.8 | 10.0 |
| 2011Q4 | 2.0 | -1.5 | 2.5 | 3.7 | 0.5 | 5.2 |
| 2012Q4 | 0.3 | -1.8 | 4.1 | 7.6 | 3.7 | 9.7 |
| 2013Q4a | 0.5 | -1.8 | 1.5 | 7.2 | 0.9 | 9.2 |
| Five-Year Average for Q4 | -0.4 | -2.1 | 1.1 | 6.5 | 1.6 | 8.8 |
|
Average Monthly Employment |
Total Wages |
|
|---|---|---|
| aPreliminary.
Source: Quarterly Census of Employment and Wages, developed through a cooperative program between Research & Planning and the U.S. Bureau of Labor Statistics. Extract date: April 2014. |
||
| 2004Q4 | 2.4 | 6.5 |
| 2005Q1 | 1.9 | 6.6 |
| 2005Q2 | 2.1 | 8.3 |
| 2005Q3 | 2.7 | 11.7 |
| 2005Q4 | 3.4 | 10.1 |
| 2006Q1 | 5.1 | 15.1 |
| 2006Q2 | 5.0 | 15.5 |
| 2006Q3 | 4.6 | 14.8 |
| 2006Q4 | 5.1 | 17.1 |
| 2007Q1 | 4.8 | 14.5 |
| 2007Q2 | 3.9 | 12.4 |
| 2007Q3 | 3.7 | 8.0 |
| 2007Q4 | 3.8 | 11.3 |
| 2008Q1 | 3.6 | 10.6 |
| 2008Q2 | 3.1 | 8.7 |
| 2008Q3 | 3.4 | 10.1 |
| 2008Q4 | 2.4 | 6.8 |
| 2009Q1 | -1.0 | -1.2 |
| 2009Q2 | -3.4 | -5.0 |
| 2009Q3 | -5.3 | -8.4 |
| 2009Q4 | -6.3 | -8.4 |
| 2010Q1 | -4.7 | -4.9 |
| 2010Q2 | -1.7 | 1.1 |
| 2010Q3 | 0.0 | 4.8 |
| 2010Q4 | 1.1 | 6.0 |
| 2011Q1 | 1.1 | 5.4 |
| 2011Q2 | 0.8 | 4.7 |
| 2011Q3 | 1.4 | 6.5 |
| 2011Q4 | 2.0 | 2.5 |
| 2012Q1 | 2.5 | 8.0 |
| 2012Q2 | 2.2 | 4.8 |
| 2012Q3 | 0.7 | 0.2 |
| 2012Q4 | 0.3 | 4.1 |
| 2013Q1 | 0.3 | 1.1 |
| 2013Q2 | 0.2 | 0.6 |
| 2013Q3 | 0.5 | 1.9 |
| 2013Q4a | 0.5 | 1.5 |
| County | Average Monthly Employment | Total Payroll | Average Weekly Wage | |||||||||
|---|---|---|---|---|---|---|---|---|---|---|---|---|
| Fourth Quarter | Change | Fourth Quarter | Change | Fourth Quarter | Change | |||||||
| 2012 | 2013 | n | % | 2012 | 2013 | $ | % | 2012 | 2013 | $ | % | |
| Total | 278,934 | 280,441 | 1,507 | 0.5 | $3,294,064,060 | $3,342,813,651 | $48,749,591 | 1.5 | $908 | $917 | $8 | 0.9 |
| Albany | 15,506 | 15,635 | 129 | 0.8 | $143,212,410 | $147,279,108 | $4,066,698 | 2.8 | $710 | $725 | $15 | 2.1 |
| Big Horn | 4,264 | 4,257 | -7 | -0.2 | 42,407,009 | 44,081,303 | 1,674,294 | 3.9 | 765 | 797 | 32 | 4.2 |
| Campbell | 27,693 | 27,789 | 96 | 0.3 | 400,281,968 | 405,736,249 | 5,454,281 | 1.4 | 1,112 | 1,123 | 11 | 1.0 |
| Carbon | 6,876 | 7,277 | 401 | 5.8 | 74,735,631 | 84,837,159 | 10,101,528 | 13.5 | 836 | 897 | 61 | 7.3 |
| Converse | 6,007 | 6,256 | 249 | 4.1 | 71,323,481 | 76,643,686 | 5,320,205 | 7.5 | 913 | 942 | 29 | 3.2 |
| Crook | 2,345 | 2,287 | -58 | -2.5 | 22,104,717 | 22,265,364 | 160,647 | 0.7 | 725 | 749 | 24 | 3.3 |
| Fremont | 16,939 | 16,751 | -188 | -1.1 | 171,205,065 | 175,308,980 | 4,103,915 | 2.4 | 777 | 805 | 28 | 3.6 |
| Goshen | 4,719 | 4,747 | 28 | 0.6 | 40,720,869 | 41,427,087 | 706,218 | 1.7 | 664 | 671 | 7 | 1.1 |
| Hot Springs | 2,111 | 2,090 | -21 | -1.0 | 19,309,663 | 20,390,684 | 1,081,021 | 5.6 | 704 | 750 | 46 | 6.5 |
| Johnson | 3,310 | 3,349 | 39 | 1.2 | 30,762,394 | 31,681,806 | 919,412 | 3.0 | 715 | 728 | 13 | 1.8 |
| Laramie | 44,337 | 45,632 | 1,295 | 2.9 | 500,163,410 | 491,155,767 | -9,007,643 | -1.8 | 868 | 828 | -40 | -4.6 |
| Lincoln | 5,738 | 5,667 | -71 | -1.2 | 63,455,165 | 65,145,347 | 1,690,182 | 2.7 | 851 | 884 | 33 | 3.9 |
| Natrona | 41,701 | 42,142 | 441 | 1.1 | 543,274,087 | 557,427,061 | 14,152,974 | 2.6 | 1,002 | 1,017 | 15 | 1.5 |
| Niobrara | 954 | 1,009 | 55 | 5.8 | 7,868,998 | 9,758,698 | 1,889,700 | 24.0 | 634 | 744 | 110 | 17.4 |
| Park | 13,326 | 13,167 | -159 | -1.2 | 131,192,759 | 132,104,907 | 912,148 | 0.7 | 757 | 772 | 15 | 2.0 |
| Platte | 3,350 | 3,423 | 73 | 2.2 | 31,791,588 | 33,788,035 | 1,996,447 | 6.3 | 730 | 759 | 29 | 4.0 |
| Sheridan | 12,886 | 13,143 | 257 | 2.0 | 136,948,908 | 133,343,391 | -3,605,517 | -2.6 | 818 | 780 | -38 | -4.6 |
| Sublette | 5,240 | 5,123 | -117 | -2.2 | 81,215,778 | 78,798,809 | -2,416,969 | -3.0 | 1,192 | 1,183 | -9 | -0.8 |
| Sweetwater | 25,227 | 24,552 | -675 | -2.7 | 361,102,979 | 356,529,217 | -4,573,762 | -1.3 | 1,101 | 1,117 | 16 | 1.5 |
| Teton | 16,375 | 17,055 | 680 | 4.2 | 192,143,397 | 190,460,002 | -1,683,395 | -0.9 | 903 | 859 | -44 | -4.9 |
| Uinta | 9,119 | 8,859 | -260 | -2.9 | 96,601,100 | 124,474,286 | 27,873,186 | 28.9 | 815 | 1,081 | 266 | 32.6 |
| Washakie | 3,971 | 3,832 | -139 | -3.5 | 39,216,697 | 38,664,489 | -552,208 | -1.4 | 760 | 776 | 16 | 2.1 |
| Weston | 2,360 | 2,362 | 2 | 0.1 | 21,239,702 | 21,698,604 | 458,902 | 2.2 | 692 | 707 | 15 | 2.2 |
| Nonclassifiedb | 4,579 | 4,038 | -541 | -11.8 | 71,786,285 | 59,813,612 | -11,972,673 | -16.7 | 1,206 | 1,139 | -67 | -5.5 |
| aPreliminary. bThe employer may be located statewide or in more than one county. Source: Quarterly Census of Employment and Wages, developed through a cooperative program between Research & Planning and the U.S. Bureau of Labor Statistics. Extract date: April 2014. |
||||||||||||
| Average Monthly Employment | Total Payroll | Average Weekly Wage | ||||||||||
|---|---|---|---|---|---|---|---|---|---|---|---|---|
| NAICSb Title | Fourth Quarter | Change | Fourth Quarter | Change | Fourth Quarter | Change | ||||||
| 2012 | 2013 | n | % | 2012 | 2013 | $ | % | 2012 | 2013 | $ | % | |
| Total, All Industries | 41,701 | 42,142 | 441 | 1.1 | $543,274,087 | $557,427,061 | $14,152,974 | 2.6 | $1,002 | $1,017 | $15 | 1.5 |
| Total Private | 35,947 | 36,310 | 363 | 1.0 | $473,608,230 | $488,446,635 | $14,838,405 | 3.1 | $1,013 | $1,035 | $22 | 2.2 |
| Agriculture | 119 | 111 | -8 | -6.7 | 844,778 | 918,565 | 73,787 | 8.7 | 546 | 637 | 91 | 16.7 |
| Mining | 4,078 | 4,164 | 86 | 2.1 | 97,966,924 | 102,787,539 | 4,820,615 | 4.9 | 1,848 | 1,899 | 51 | 2.8 |
| Utilities | 136 | 138 | 2 | 1.5 | 3,116,607 | 3,685,290 | 568,683 | 18.2 | 1,763 | 2,054 | 291 | 16.5 |
| Construction | 3,109 | 3,177 | 68 | 2.2 | 47,249,456 | 48,990,445 | 1,740,989 | 3.7 | 1,169 | 1,186 | 17 | 1.5 |
| Manufacturing | 1,855 | 1,702 | -153 | -8.2 | 25,298,076 | 24,888,910 | -409,166 | -1.6 | 1,049 | 1,125 | 76 | 7.2 |
| Wholesale Trade | 2,753 | 2,878 | 125 | 4.5 | 49,591,767 | 54,242,917 | 4,651,150 | 9.4 | 1,386 | 1,450 | 64 | 4.6 |
| Retail Trade | 4,922 | 5,034 | 112 | 2.3 | 36,145,529 | 40,281,667 | 4,136,138 | 11.4 | 565 | 616 | 51 | 9.0 |
| Transportation & Warehousing | 1,204 | 1,236 | 32 | 2.7 | 17,298,774 | 18,730,037 | 1,431,263 | 8.3 | 1,105 | 1,166 | 61 | 5.5 |
| Information | 464 | 435 | -29 | -6.3 | 4,552,047 | 4,629,293 | 77,246 | 1.7 | 755 | 819 | 64 | 8.5 |
| Finance & Insurance | 1,050 | 1,077 | 27 | 2.6 | 15,420,357 | 15,342,956 | -77,401 | -0.5 | 1,130 | 1,096 | -34 | -3.0 |
| Real Estate & Rental & Leasing | 939 | 992 | 53 | 5.6 | 11,563,143 | 12,532,039 | 968,896 | 8.4 | 947 | 972 | 25 | 2.6 |
| Professional & Technical Services | 1,499 | 1,479 | -20 | -1.3 | 26,480,967 | 26,737,825 | 256,858 | 1.0 | 1,359 | 1,391 | 32 | 2.4 |
| Mgmt. of Companies & Enterprises | 218 | 205 | -13 | -6.0 | 4,488,413 | 4,524,350 | 35,937 | 0.8 | 1,584 | 1,698 | 114 | 7.2 |
| Administrative & Waste Services | 1,307 | 1,383 | 76 | 5.8 | 10,581,987 | 11,422,818 | 840,831 | 7.9 | 623 | 635 | 12 | 1.9 |
| Educational Services | 148 | 155 | 7 | 4.7 | 955,387 | 796,831 | -158,556 | -16.6 | 497 | 395 | -102 | -20.5 |
| Health Care & Social Assistance | 5,695 | 5,804 | 109 | 1.9 | 79,778,282 | 79,858,993 | 80,711 | 0.1 | 1,078 | 1,058 | -20 | -1.9 |
| Ambulatory Health Care Services | 2,052 | 2,123 | 71 | 3.5 | 43,927,158 | 44,005,707 | 78,549 | 0.2 | 1,647 | 1,594 | -53 | -3.2 |
| Hospitals | 1,631 | 1,635 | 4 | 0.2 | 22,737,859 | 22,415,079 | -322,780 | -1.4 | 1,072 | 1,055 | -17 | -1.6 |
| Nursing & Residential Care Facilities | 948 | 964 | 16 | 1.7 | 7,463,652 | 7,678,650 | 214,998 | 2.9 | 606 | 613 | 7 | 1.2 |
| Social assistance | 1,064 | 1,082 | 18 | 1.7 | 5,649,613 | 5,759,557 | 109,944 | 1.9 | 408 | 409 | 1 | 0.2 |
| Arts, Entertainment, & Recreation | 421 | 442 | 21 | 5.0 | 1,730,778 | 1,782,107 | 51,329 | 3.0 | 316 | 310 | -6 | -1.9 |
| Accommodation & Food Services | 3,954 | 4,118 | 164 | 4.1 | 16,446,041 | 16,836,459 | 390,418 | 2.4 | 320 | 315 | -5 | -1.6 |
| Other Services | 2,076 | 1,779 | -297 | -14.3 | 24,098,917 | 19,457,594 | -4,641,323 | -19.3 | 893 | 841 | -52 | -5.8 |
| Total Government | 5,754 | 5,832 | 78 | 1.4 | $69,665,857 | $68,980,426 | -$685,431 | -1.0 | $931 | $910 | -$21 | -2.3 |
| Federal Government | 667 | 638 | -29 | -4.3 | 11,564,464 | 9,871,855 | -1,692,609 | -14.6 | 1,334 | 1,190 | -144 | -10.8 |
| State Government | 719 | 710 | -9 | -1.3 | 9,661,380 | 9,552,786 | -108,594 | -1.1 | 1,034 | 1,035 | 1 | 0.1 |
| Local Government | 4,368 | 4,484 | 116 | 2.7 | 48,440,013 | 49,555,785 | 1,115,772 | 2.3 | 853 | 850 | -3 | -0.4 |
| Local Government Education | ND | ND | ND | ND | ND | ND | ND | ND | ND | ND | ND | ND |
|
||||||||||||
| NAICSb Title | ||||||||||||
|---|---|---|---|---|---|---|---|---|---|---|---|---|
| Average Monthly Employment | Total Payroll | Average Weekly Wage | ||||||||||
| Fourth Quarter | Change | Fourth Quarter | Change | Fourth Quarter | Change | |||||||
| 2012 | 2013 | n | % | 2012 | 2013 | $ | % | 2012 | 2013 | $ | % | |
| Total, All Industries | 44,337 | 45,632 | 1,295 | 2.9 | $500,163,410 | $491,155,767 | -$9,007,643 | -1.8 | $868 | $828 | -$40 | -4.6 |
| Total Private | 30,524 | 31,927 | 1,403 | 4.6 | $327,227,948 | $317,912,897 | -$9,315,051 | -2.8 | $825 | $766 | -$59 | -7.2 |
| Agriculture | 309 | 325 | 16 | 5.2 | 2,538,053 | 2,745,116 | 207,063 | 8.2 | 632 | 650 | 18 | 2.8 |
| Mining | 223 | 274 | 51 | 22.9 | 4,208,459 | 5,742,329 | 1,533,870 | 36.4 | 1,452 | 1,612 | 160 | 11.0 |
| Utilities | 144 | 157 | 13 | 9.0 | 2,769,393 | 3,173,127 | 403,734 | 14.6 | 1,479 | 1,555 | 76 | 5.1 |
| Construction | 2,939 | 3,280 | 341 | 11.6 | 34,020,877 | 40,437,838 | 6,416,961 | 18.9 | 890 | 948 | 58 | 6.5 |
| Manufacturing | 1,330 | 1,365 | 35 | 2.6 | 22,543,235 | 23,869,091 | 1,325,856 | 5.9 | 1,304 | 1,345 | 41 | 3.1 |
| Wholesale Trade | 934 | 985 | 51 | 5.5 | 13,882,154 | 14,078,477 | 196,323 | 1.4 | 1,143 | 1,099 | -44 | -3.8 |
| Retail Trade | 5,606 | 5,842 | 236 | 4.2 | 55,109,027 | 38,491,892 | -16,617,135 | -30.2 | 756 | 507 | -249 | -32.9 |
| Transportation & Warehousing | 2,438 | 2,627 | 189 | 7.8 | 24,970,339 | 26,300,243 | 1,329,904 | 5.3 | 788 | 770 | -18 | -2.3 |
| Information | 1,140 | 1,135 | -5 | -0.4 | 13,924,999 | 14,304,095 | 379,096 | 2.7 | 940 | 969 | 29 | 3.1 |
| Finance & Insurance | 1,628 | 1,687 | 59 | 3.6 | 24,467,444 | 23,227,484 | -1,239,960 | -5.1 | 1,156 | 1,059 | -97 | -8.4 |
| Real Estate & Rental & Leasing | 556 | 571 | 15 | 2.7 | 5,315,381 | 5,641,041 | 325,660 | 6.1 | 735 | 760 | 25 | 3.4 |
| Professional & Technical Services | 1,506 | 1,600 | 94 | 6.2 | 23,514,624 | 26,240,145 | 2,725,521 | 11.6 | 1,201 | 1,262 | 61 | 5.1 |
| Mgmt. of Companies & Enterprises | 78 | 94 | 16 | 20.5 | 1,244,874 | 1,433,733 | 188,859 | 15.2 | 1,228 | 1,173 | -55 | -4.5 |
| Administrative & Waste Services | 1,640 | 1,674 | 34 | 2.1 | 10,675,182 | 10,831,262 | 156,080 | 1.5 | 501 | 498 | -3 | -0.6 |
| Educational Services | 275 | 245 | -30 | -10.9 | 1,762,662 | 1,591,458 | -171,204 | -9.7 | 493 | 500 | 7 | 1.4 |
| Health Care & Social Assistance | 4,020 | 4,029 | 9 | 0.2 | 59,284,393 | 47,330,728 | -11,953,665 | -20.2 | 1,134 | 904 | -230 | -20.3 |
| Ambulatory Health Care Services | 1,949 | 2,023 | 74 | 3.8 | 46,157,807 | 34,271,221 | -11,886,586 | -25.8 | 1,822 | 1,303 | -519 | -28.5 |
| Nursing & Residential Care Facilties | 845 | 852 | 7 | 0.8 | 6,243,099 | 6,442,314 | 199,215 | 3.2 | 568 | 582 | 14 | 2.5 |
| Hospitals & Social Assistance | 1,226 | 1,154 | -71 | -5.8 | 6,883,487 | 6,617,193 | -266,294 | -3.9 | 432 | 441 | 9 | 2.1 |
| Arts, Entertainment, & Recreation | 268 | 277 | 9 | 3.4 | 946,821 | 1,261,875 | 315,054 | 33.3 | 272 | 350 | 78 | 28.7 |
| Accommodation & Food Services | 4,184 | 4,342 | 158 | 3.8 | 16,389,642 | 16,921,286 | 531,644 | 3.2 | 301 | 300 | -1 | -0.3 |
| Other Services | 1,306 | 1,419 | 113 | 8.7 | 9,660,389 | 14,291,677 | 4,631,288 | 47.9 | 569 | 775 | 206 | 36.2 |
| Total Government | 13,813 | 13,705 | -108 | -0.8 | $172,935,462 | $173,242,870 | $307,408 | 0.2 | $963 | $972 | $9 | 0.9 |
| Federal Government | 2,558 | 2,504 | -54 | -2.1 | 39,406,245 | 37,278,629 | -2,127,616 | -5.4 | 1,185 | 1,145 | -40 | -3.4 |
| State Government | 3,973 | 3,933 | -40 | -1.0 | 57,387,805 | 57,255,617 | -132,188 | -0.2 | 1,111 | 1,120 | 9 | 0.8 |
| Local Government | 7,283 | 7,268 | -15 | -0.2 | 76,141,412 | 78,708,624 | 2,567,212 | 3.4 | 804 | 833 | 29 | 3.6 |
| Local Government Education | 3,835 | 3,857 | 22 | 0.6 | 38,543,421 | 40,390,677 | 1,847,256 | 4.8 | 773 | 806 | 32 | 4.2 |
| aPreliminary. bNorth American Industry Classification System. Source: Quarterly Census of Employment and Wages, developed through a cooperative program between Research & Planning and the U.S. Bureau of Labor Statistics. Extract date: April 2014. |
||||||||||||
| Average Monthly Employment | Total Payroll | Average Weekly Wage | ||||||||||
|---|---|---|---|---|---|---|---|---|---|---|---|---|
| Fourth Quarter | Change | Fourth Quarter | Change | Fourth Quarter | Change | |||||||
| NAICSb Title | 2012 | 2013 | n | % | 2012 | 2013 | $ | % | 2012 | 2013 | $ | % |
| aPreliminary. bNorth American Industry Classification System. Source: Quarterly Census of Employment and Wages, developed through a cooperative program between Research & Planning and the U.S. Bureau of Labor Statistics. Extract date: April 2014. |
||||||||||||
| Total, All Industries | 278,934 | 280,441 | 1,507 | 0.5 | $3,294,064,060 | $3,342,813,651 | $48,749,591 | 1.5 | $908 | $917 | $9 | 1.0 |
| Total Private | 211,198 | 213,079 | 1,881 | 0.9 | $2,530,292,152 | $2,575,589,441 | $45,297,289 | 1.8 | $922 | $930 | $8 | 0.9 |
| Agriculture | 2,481 | 2,572 | 91 | 3.7 | 22,998,282 | 24,810,215 | 1,811,933 | 7.9 | 713 | 742 | 29 | 4.1 |
| Mining | 27,236 | 26,827 | -409 | -1.5 | 581,212,005 | 593,370,740 | 12,158,735 | 2.1 | 1,642 | 1,701 | 59 | 3.6 |
| Utilities | 2,462 | 2,476 | 14 | 0.6 | 54,366,342 | 57,591,709 | 3,225,367 | 5.9 | 1,699 | 1,789 | 90 | 5.3 |
| Construction | 21,926 | 22,285 | 359 | 1.6 | 293,085,059 | 326,186,060 | 33,101,001 | 11.3 | 1,028 | 1,126 | 98 | 9.5 |
| Manufacturing | 9,683 | 9,767 | 84 | 0.9 | 141,266,781 | 145,635,301 | 4,368,520 | 3.1 | 1,122 | 1,147 | 25 | 2.2 |
| Wholesale Trade | 9,127 | 9,428 | 301 | 3.3 | 146,161,039 | 151,146,015 | 4,984,976 | 3.4 | 1,232 | 1,233 | 1 | 0.1 |
| Retail Trade | 29,819 | 30,187 | 368 | 1.2 | 222,259,332 | 211,043,162 | -11,216,170 | -5.0 | 573 | 538 | -35 | -6.1 |
| Transportation & Warehousing | 9,672 | 9,926 | 254 | 2.6 | 117,803,346 | 123,297,213 | 5,493,867 | 4.7 | 937 | 956 | 19 | 2.0 |
| Information | 3,847 | 3,802 | -45 | -1.2 | 42,073,893 | 42,902,015 | 828,122 | 2.0 | 841 | 868 | 27 | 3.2 |
| Finance & Insurance | 6,686 | 6,791 | 105 | 1.6 | 98,131,940 | 96,128,098 | -2,003,842 | -2.0 | 1,129 | 1,089 | -40 | -3.5 |
| Real Estate & Rental & Leasing | 4,135 | 4,392 | 257 | 6.2 | 47,311,061 | 52,778,258 | 5,467,197 | 11.6 | 880 | 924 | 44 | 5.0 |
| Professional & Technical Services | 9,276 | 9,254 | -22 | -0.2 | 156,285,254 | 164,439,806 | 8,154,552 | 5.2 | 1,296 | 1,367 | 71 | 5.5 |
| Mgmt. of Companies & Enterprises | 984 | 1,016 | 32 | 3.3 | 38,041,164 | 21,457,453 | -16,583,711 | -43.6 | 2,974 | 1,625 | -1,349 | -45.4 |
| Administrative & Waste Services | 7,588 | 7,914 | 326 | 4.3 | 59,860,609 | 63,735,842 | 3,875,233 | 6.5 | 607 | 620 | 13 | 2.1 |
| Educational Services | 1,682 | 1,754 | 72 | 4.3 | 12,630,306 | 13,491,866 | 861,560 | 6.8 | 578 | 592 | 14 | 2.4 |
| Health Care & Social Assistance | 23,855 | 23,986 | 131 | 0.5 | 280,162,587 | 267,843,122 | -12,319,465 | -4.4 | 903 | 859 | -44 | -4.9 |
| Ambulatory Health Care Services | 9,349 | 9,500 | 151 | 1.6 | 168,016,931 | 154,828,315 | -13,188,616 | -7.8 | 1,382 | 1,254 | -128 | -9.3 |
| Hospitals | 3,081 | 3,038 | -43 | -1.4 | 41,637,511 | 41,822,941 | 185,430 | 0.4 | 1,040 | 1,059 | 19 | 1.8 |
| Nursing & Res. Care Facilities | 4,567 | 4,524 | -43 | -0.9 | 33,548,614 | 33,585,247 | 36,633 | 0.1 | 565 | 571 | 6 | 1.1 |
| Social Assistance | 6,858 | 6,924 | 66 | 1.0 | 36,959,531 | 37,606,619 | 647,088 | 1.8 | 415 | 418 | 3 | 0.7 |
| Arts, Entertainment, & Recreation | 2,488 | 2,535 | 47 | 1.9 | 12,874,584 | 13,483,947 | 609,363 | 4.7 | 398 | 409 | 11 | 2.8 |
| Accommodation & Food Services | 29,768 | 30,174 | 406 | 1.4 | 127,542,251 | 130,787,128 | 3,244,877 | 2.5 | 330 | 333 | 3 | 0.9 |
| Other Services | 8,481 | 7,994 | -487 | -5.7 | 76,226,317 | 75,461,491 | -764,826 | -1.0 | 691 | 726 | 35 | 5.1 |
| Total Government | 67,736 | 67,362 | -374 | -0.6 | $763,771,908 | $767,224,210 | $3,452,302 | 0.5 | $867 | $876 | $9 | 1.0 |
| Federal Government | 7,274 | 7,128 | -146 | -2.0 | 108,899,760 | 99,289,364 | -9,610,396 | -8.8 | 1,152 | 1,071 | -81 | -7.0 |
| State Government | 13,156 | 13,013 | -143 | -1.1 | 171,361,710 | 172,840,201 | 1,478,491 | 0.9 | 1,002 | 1,022 | 20 | 2.0 |
| State Government Education | 3,564 | 3,533 | -31 | -0.9 | 44,054,968 | 46,643,185 | 2,588,217 | 5.9 | 951 | 1,016 | 65 | 6.8 |
| Local Government | 47,306 | 47,221 | -85 | -0.2 | 483,510,438 | 495,094,645 | 11,584,207 | 2.4 | 786 | 807 | 21 | 2.7 |
| Local Government Education | 24,887 | 24,797 | -90 | -0.4 | 244,714,562 | 248,891,214 | 4,176,652 | 1.7 | 756 | 772 | 16 | 2.1 |
| Hospitals | 6,976 | 7,056 | 80 | 1.2 | 91,462,901 | 97,253,065 | 5,790,164 | 6.3 | 1,009 | 1,060 | 52 | 5.1 |