
Economic Indicators
Total nonfarm employment (measured by place of work) rose by 0.6% from May 2013 to May 2014.
| May | Apr | May |
Percent Change |
||||
|---|---|---|---|---|---|---|---|
|
2014 (p) |
2014 (r) |
2013 (b) |
Month | Year | |||
|
(p) Preliminary. (r) Revised. (b) Benchmarked. 1Local Area Unemployment Statistics Program estimates. 2Metropolitan Statistical Area. Note: Production worker hours and earnings data have been dropped from the Economic Indicators page because of problems with accuracy due to a small sample size and high item nonresponse. The U.S. Bureau of Labor Statistics will continue to publish these data online at http://www.bls.gov/eag/eag.wy.htm. |
|||||||
| Wyoming Total Nonfarm Employment | 293,300 | 286,400 | 291,600 | 2.4 | 0.6 | ||
| Wyoming State Government | 15,900 | 15,900 | 16,200 | 0.0 | -1.9 | ||
| Laramie County Nonfarm Employment | 46,000 | 45,700 | 46,400 | 0.7 | -0.9 | ||
| Natrona County Nonfarm Employment | 41,700 | 41,300 | 42,600 | 1.0 | -2.1 | ||
| Selected U.S. Employment Data | |||||||
| U.S. Multiple Jobholders | 7,305,000 | 7,162,000 | 7,123,000 | 2.0 | 2.6 | ||
| As a percent of all workers | 5.0% | 4.9% | 4.9% | N/A | N/A | ||
| U.S. Discouraged Workers | 697,000 | 783,000 | 780,000 | -11.0 | -10.6 | ||
| U.S. Part Time for Economic Reasons | 6,960,000 | 7,243,000 | 7,618,000 | -3.9 | -8.6 | ||
| Wyoming Unemployment Insurance | |||||||
| Weeks Compensated | 12,935 | 19,432 | 18,710 | -33.4 | -30.9 | ||
| Benefits Paid | $4,596,616 | $6,833,506 | $6,579,671 | -32.7 | -30.1 | ||
| Average Weekly Benefit Payment | $355.36 | $351.66 | $351.67 | 1.1 | 1.0 | ||
| State Insured Covered Jobs1 | 272,892 | 265,981 | 269,453 | 2.6 | 1.3 | ||
| Insured Unemployment Rate | 1.8% | 2.2% | 2.5% | N/A | N/A | ||
| Consumer Price Index (U) for All U.S. Urban Consumers | |||||||
| (1982 to 1984 = 100) | |||||||
| All Items | 237.9 | 237.1 | 232.9 | 0.3 | 2.1 | ||
| Food & Beverages | 242.1 | 241.1 | 236.5 | 0.4 | 2.4 | ||
| Housing | 232.7 | 231.7 | 226.9 | 0.5 | 2.6 | ||
| Apparel | 129.0 | 129.6 | 128.0 | -0.5 | 0.8 | ||
| Transportation | 223.4 | 222.0 | 219.4 | 0.6 | 1.8 | ||
| Medical Care | 434.9 | 434.1 | 422.8 | 0.2 | 2.8 | ||
| Recreation (Dec. 1997=100) | 116.0 | 116.0 | 115.6 | 0.0 | 0.4 | ||
| Education & Communication (Dec. 1997=100) | 137.2 | 137.3 | 135.2 | 0.0 | 1.5 | ||
| Other Goods & Services | 407.2 | 407.0 | 400.0 | 0.0 | 1.8 | ||
| Producer Prices (1982 to 1984 = 100) | |||||||
| All Commodities | 208.0 | 208.4 | 204.1 | -0.2 | 1.9 | ||
| Wyo. Bldg. Permits (New Privately Owned Housing Units Authorized) | |||||||
| Total Units | 197 | 263 | 333 | -25.1 | -40.8 | ||
| Valuation | $58,229,000 | $52,407,000 | $54,482,000 | 11.1 | 6.9 | ||
| Single Family Homes | 175 | 147 | 158 | 19.0 | 10.8 | ||
| Valuation | $56,523,000 | $44,704,000 | $40,764,000 | 26.4 | 38.7 | ||
| Casper MSA2 Building Permits | 26 | 40 | 31 | -35.0 | -16.1 | ||
| Valuation | $5,827,000 | $6,702,000 | $4,488,000 | -13.1 | 29.8 | ||
| Cheyenne MSA Building Permits | 48 | 22 | 193 | 118.2 | -75.1 | ||
| Valuation | $6,925,000 | $4,251,000 | $18,629,000 | 62.9 | -62.8 | ||
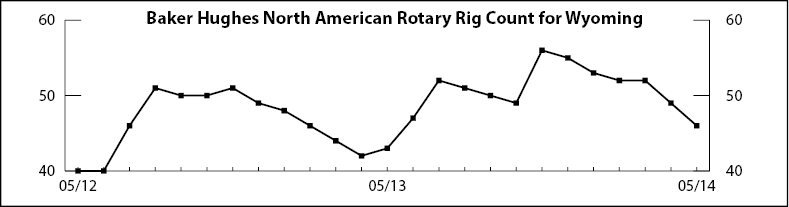
| Baker Hughes North American Rotary Rig Count for Wyoming | 46 | 49 | 43 | -6.1 | 7.0 | ||
|
|||||||