
Local Jobs and Payroll in Wyoming in Fourth Quarter 2013: Modest Job Growth Continues
The purpose of this article is to illustrate and describe employment and payroll changes between fourth quarter 2012 and fourth quarter 2013. These economic changes help gauge the overall strength of Wyoming’s economy and identify the fastest and slowest growing sectors and geographic areas.
|
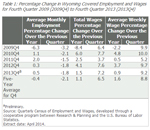
Total unemployment insurance (UI) covered payroll increased by $48.7 million (1.5%) in fourth quarter 2013. Employment rose by 1,507 jobs (0.5%) and average weekly wage increased by $8 (0.9%). In fourth quarter, employment grew faster than its five-year average (0.5% compared to -0.4%), total wages grew faster than their five-year average (1.5% compared to 1.1%), but average weekly wage grew slower than its five-year average (0.9% compared to 1.6%; see Table 1). Job losses in the mining sector (including oil & gas) were smaller than in third quarter (-409 jobs, or -1.5% compared to -729 jobs, or -2.7%). In terms of dollars, UI covered payroll represents approximately 91.5% of all wage and salary disbursements and 43.8% of personal income in the state (U.S. Bureau of Economic Analysis, 2014). Analysts have noted that “minerals related employment is one of the key predictors of sales and use tax revenue” in Wyoming (CREG 2010).
Despite the recent growth, overall employment remained approximately 7,000 jobs (2.4%) below its fourth quarter 2008 level. In short, the state has yet to make up all the job losses of 2009 and 2010.
The covered payroll and employment data in this article are tabulated by place of work, in contrast to the labor force estimates, which are a measure of employed and unemployed persons by place of residence. Also, the employment data presented in this article represent a count of jobs, not persons. When individuals work more than one job, each job is counted separately. Finally, job growth (or decline) is stated in terms of net change. The Quarterly Turnover Statistics by Industry table presents alternative measures of job gains and losses using the same data sources and calculated to describe the components of change.
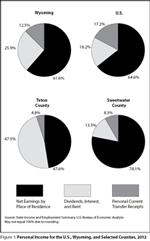
Wages and salaries, while very important, are only one component of personal income. Figure 1 shows 2012 personal income for Wyoming, the U.S. and selected counties broken into three broad categories. Net earnings includes wages, salaries, proprietor’s income, and supplements to wages & salaries, such as employer-paid benefits. In Wyoming, this category accounts for more than three-fifths (61.6%) of personal income (Bureau of Economic Analysis, 2014). The next largest category is dividends, interest, and rent (25.9% of personal income). Finally, transfer receipts make up 12.5% of personal income. Transfer receipts include Social Security, Medicare, Medicaid, unemployment insurance, and veteran’s benefits.
In the U.S., net earnings are slightly more important than in Wyoming (64.6% compared to 61.6%) and transfer receipts make up a larger part of personal income (17.2% compared to 12.5%). Dividends, interest, and rent account for a smaller part of U.S. personal income than in Wyoming (18.2% compared to 25.9%).
|
Teton County’s per capita personal income is much higher than Wyoming’s ($93,194, compared to $50,567). As can be seen in Figure 1, dividends, interest, and rent make up a larger part of Teton County’s personal income (47.5%). Transfer receipts account for a considerably smaller part (4.8%) of personal income in Teton County than in the U.S. (17.2%) and Wyoming (12.5%).
Net earnings make up more than three-quarters (78.1%) of personal income in Sweetwater County, and both transfer receipts and dividends, interest, & rent are relatively less important there.
As Figure 1 illustrates, wages & salaries vary in importance across areas. They account for less than half of all personal income in Teton County, but more than three-quarters in Sweetwater County. Thus, a similar level of growth or decline in total payroll could have a different economic impact on different areas of the state.
|
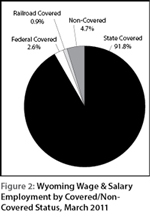
Figure 2 shows Wyoming wage & salary employment by covered/non-covered status. Approximately 92% of wage & salary jobs in the state are covered by state unemployment insurance, while 2.6% of jobs are covered by federal unemployment insurance, and 0.9% are covered by unemployment insurance administered by the railroad retirement board. There are several categories of non-covered jobs, and together they account for approximately 5% of wage & salary jobs in the state. Some examples of non-covered employment include elected officials, students working at educational institutions, employees of churches, and workers at small non-profit organizations.
|
|
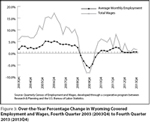
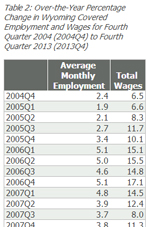
Figure 3 shows that the level of job growth fell from 2.5% in first quarter 2012 to 0.2% in second quarter 2013, its slowest pace since third quarter 2010. Job growth rebounded modestly in third quarter, increasing to 0.5%, and remained at that level in fourth quarter. Total payroll growth rose from 0.6% in second quarter to 1.5% in fourth quarter (see Table 2).
Employment and Wages by County
|
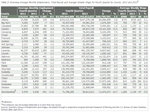
Employment rose in 13 counties and fell in 10 counties (see Table 3). Total payroll increased in 17 counties and decreased in 6 counties.
Teton County added 680 jobs (4.2%), but its total payroll fell by $1.7 million (-0.9%). Large job gains were seen in construction, retail trade, accommodation & food services, education, and professional & technical services. The decrease in total payroll appears related to the large bonuses that were paid in fourth quarter 2012, but not repeated in 2013. This was seen in management of companies & enterprises and finance & insurance.
Employment increased by 401 jobs (5.8%) in Carbon County and total payroll rose by $10.1 million (13.5%). Sizeable job gains occurred in construction, administrative & waste services, accommodation & food services, and health care & social assistance.
Sheridan County’s employment rose by 257 jobs (2.0%), but its total payroll decreased by $3.6 million (-2.6%). Job gains were seen in construction, retail trade, accommodation & food services, and manufacturing. Total payroll decreased in health care & social assistance (-$1.8 million).
Converse County added 249 jobs (4.1%) and its total payroll rose by $5.3 million (7.5%). Employment increased in transportation & warehousing, mining (including oil & gas), construction, local government, manufacturing, and administrative & waste services.
Employment in Albany County rose by 129 jobs (0.8%) and total payroll increased by $4.1 million (2.8%). The largest job gains occurred in accommodation & food services, retail trade, and administrative & waste services.
Sweetwater County lost 675 jobs (-2.7%) and its total payroll fell by $4.6 million (-1.3%). Notable job losses were seen in construction (more than 450 jobs) and mining (including oil & gas; approximately 350 jobs). Employment increased in real estate & rental & leasing, management of companies & enterprises, and administrative & waste services.
Employment fell by 260 jobs (-2.9%) in Uinta County, but total payroll rose by $27.9 million (28.9%). Small job losses were seen in many sectors, including construction, mining, accommodation & food services, other services, and local government. Construction payroll increased by $28.6 million.
Employment in Fremont County decreased by 188 jobs (-1.1%), but total payroll rose by $4.1 million (2.4%). Job losses occurred in local government (including public schools & colleges), construction, retail trade, state government, professional & technical services, and wholesale trade. Modest job gains were seen in mining (including oil & gas), real estate & rental & leasing, and transportation & warehousing.
Park County lost 159 jobs (-1.2%), but its total payroll grew slightly ($0.9 million, or 0.7%). Employment fell in accommodation & food services; retail trade; mining (including oil & gas); and arts, entertainment, & recreation.
Washakie County’s employment declined by 139 jobs (-3.5%) and its total payroll fell by $0.5 million (-1.4%). Job losses were seen in accommodation & food services, mining (including oil & gas), other services, and administrative & waste services.
|
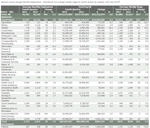
Natrona County added 441 jobs (1.1%) and its total payroll rose by $14.2 million (2.6%). Job gains in accommodation & food services (164 jobs or 4.1%), wholesale trade (125 jobs, or 4.5%), local government (including public schools & colleges; 116 jobs, or 2.7%), retail trade (112 jobs, or 2.3%), and health care & social assistance (109 jobs, or 1.9%) were partially offset by job losses in other services (-297 jobs, or -14.3%) and manufacturing (-153 jobs, or -8.2%). (Note: Due to space considerations, tables for Natrona and Laramie counties do not appear in the printed version of this issue of Trends.)
|
Laramie County gained 1,295 jobs (2.9%), but its total payroll fell by $9.0 million (-1.8%). Large job growth was seen in construction (341 jobs, or 11.6%), retail trade (236 jobs, or 4.2%), transportation & warehousing (189 jobs, or 7.8%), accommodation & food services (158 jobs, or 3.8%), and other services (113 jobs, or 8.7%). The decline in total payroll in retail trade (-$16.6 million, or -30.2%) was related to a large bonus paid in fourth quarter 2012, but not repeated in 2013.
Statewide Employment and Wages by Industry
|
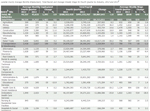
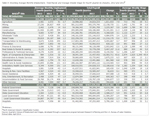
At the statewide level, the largest job gains occurred in accommodation & food services, retail trade, construction, administrative & waste services, real estate & rental & leasing, and transportation & warehousing (see Table 4). Job losses were seen in other services, mining, federal government, and state government.
Accommodation & food services added 406 jobs (1.4%) and its total payroll grew by $3.2 million (2.5%). Nearly all of the job growth was in food services & drinking places.
Employment in retail trade rose by 368 jobs (1.2%), but total payroll fell by $11.2 million (-5.0%). Large job gains in building material & garden supply stores; food & beverage stores; and sports, hobby, musical instrument & book stores were partially offset by job losses in general merchandise stores. The decline in total payroll was partially related to a bonus paid in fourth quarter 2012, but not repeated in 2013.
Construction employment grew by 359 jobs (1.6%) and its total payroll rose by $33.1 million (11.3%). Job gains in construction of buildings (approximately 200 jobs) and specialty trade contractors (approximately 500 jobs) more than offset job losses in heavy & civil engineering construction (more than 350 jobs).
Administrative & waste services added 326 jobs (4.3%) and its total payroll increased by $3.9 million (6.5%). Strong growth was seen in temporary help agencies and landscaping services.
Real estate & rental & leasing gained 257 jobs (6.2%) and its total payroll rose by $5.5 million (11.6%). The vast majority of job growth was found in rental & leasing services, especially rental of oilfield and construction machinery.
Transportation & warehousing added 254 jobs (2.6%) and its total payroll rose by $5.5 million (4.7%). Job growth was seen in truck transportation, support activities for transportation, couriers & messengers, and warehousing & storage.
Employment in other services fell by 487 jobs (-5.7%) and its total payroll decreased by $0.8 million (-1.0%). Repair & maintenance services lost approximately 250 jobs and private households lost approximately 150 jobs.
Mining lost 409 jobs (-1.5%), but its total payroll rose by $12.2 million (2.1%). Coal mining employment fell by more than 300 jobs, metal ore mining fell by approximately 50 jobs, and oil & gas employment was essentially unchanged.
Federal government employment fell by 146 jobs (-2.0%) and its total payroll fell by $9.6 million (-8.8%). Small job losses were seen in many different federal agencies.
State government lost 143 jobs (-1.1%), but its total payroll increased slightly ($1.5 million or 0.9%). Employment decreased slightly in several agencies and institutions.
Overall job growth has remained slow and steady for the past several quarters. Employment grew in several areas of the state, most notably Laramie, Teton, Natrona, and Carbon counties, while job losses were seen in Sweetwater, Uinta, Fremont, and Park counties. It appears that oil & gas employment has mostly stabilized.
References
Consensus Revenue Estimating Group (CREG) (2010, October) Wyoming state government revenue forecast fiscal year 2011-fiscal year 2016. Retrieved February 17, 2011 from http://eadiv.state.wy.us/creg/GreenCREG_Oct10.pdf
U.S. Bureau of Economic Analysis. (2014, June 17). SA04 State income and employment summary. Retrieved June 17, 2014, from http://www.bea.gov/iTable/iTable.cfm?ReqID=70&step=1&isuri=1&acrdn=4