
Training for What?
Using New Hires Survey Data to Identify Training Opportunities
Wyoming employers are constantly hiring new workers, regardless of the overall state of the economy. Even as Wyoming’s recovery from the economic downturn slowed in 2013, continuous hire and exit activity were ongoing; this is referred to as turnover. The Research & Planning (R&P) section of the Wyoming Department of Workforce Services, through access to administrative records, publishes turnover data on a quarterly basis. These administrative records allow R&P to identify turnover characteristics such as hires, exits, and continuous employment by county and industry.
However, administrative records do not tell the entire story. In 2009Q4, R&P began administering a New Hires Job Skills Survey in order to enhance what is already known about the dynamics of the labor market records by collecting a rich level of survey detail that is not available through administrative records.
This article will explain how R&P’s New Hires Job Skills Survey supplements existing administrative records research by providing rich detail such as occupation, rate of compensation, benefits, skills, employer satisfaction with a new hire’s skills, and more. This article will also help readers better understand New Hires Survey data that are available online at http://doe.state.wy.us/LMI/newhires.htm, and provide examples of how New Hires Survey data can be used to identify trends in Wyoming’s labor market and possible training opportunities for employers, educators, and training providers.
Introduction
After a period of rapid economic expansion that began in 2005 and continued through 2008, Wyoming entered an economic downturn that lasted from first quarter 2009 (2009Q1) to first quarter 2010 (2010Q1). During each of these five quarters, total employment, total payroll, and average weekly wage declined from previous-year levels, according to the Quarterly Census of Employment and Wages (Bullard, 2011). Wyoming’s recovery from that economic downturn began in 2010Q2 and continues to this day. Since 2012, Wyoming’s recovery from the economic downturn has slowed, and during 2013Q4, Wyoming’s total employment remained approximately 7,000 jobs (2.4%) below its fourth quarter 2008 level (see related article below).
Even though total employment has yet to return to its 2008 level, hires and exits are ongoing in Wyoming. In fourth quarter 2013 (2013Q4), there were 34,150 hires and 41,229 exits from jobs worked at any time during the quarter (see Quarterly Turnover Statistics).
|
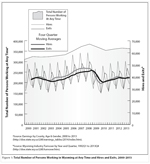
Historic turnover statistics dating back to 1992Q1 are available online at http://doe.state.wy.us/LMI/turnover.htm. Figure 1 shows that the total number of persons working in Wyoming peaked in 2008 and then declined in 2009 and 2010, and has been recovering ever since. Through all of this, a substantial amount of hire and exit activity has been ongoing.
A new hire is defined as an employee who, during a particular quarter, started working for an employer he or she had not worked for since at least 1992, the first year for which R&P has wage records (Knapp, 2011). The New Hires Job Skills Survey is sent to a random sample of employers each quarter. Since the start of the survey, R&P has attained at least a 70% response rate per quarter. The estimates presented in this article are based on New Hires Survey data collected over a two-year period from fourth quarter 2011 (2011Q4) through third quarter 2013 (2013Q3). More information on the methodology used for this survey and the full statistical results are available at http://doe.state.wy.us/LMI/newhires.htm.
There are a variety of uses for the data collected through the New Hires Survey. This article presents two ways in which readers can use data collected through the New Hires Survey.
Training
Opportunities
|
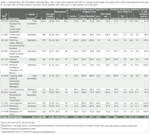
New Hires Survey data can be useful to Wyoming employers, educators, and training providers by identifying potential training opportunities. Table 1 shows 12 occupations that may present these types of opportunities. As previously mentioned, the New Hires Survey collects information on occupation, selected skills, gender, residency, and employer satisfaction. Each of these 12 occupations met three criteria:
- nonresidents made up a relatively high proportion of all new hires (20% or more);
- the average hourly wage was $20 or more; and
- the typical educational requirement was more than a high school diploma.
For example, Table 1 shows that of the estimated 346 new hires who were construction managers from 2011Q4 to 2013Q3, 42.4% (147) were nonresidents; R&P defines nonresidents as “individuals without a Wyoming-issued driver’s license or at least four quarters of work history in Wyoming” (Jones, 2002) or those for whom demographic data are not available. The high percentage of nonresidents hired to fill this occupation seems to indicate that Wyoming employers had to look outside of the state to find workers to fill jobs for this particular occupation. This may present a training opportunity for Wyoming’s educators and training providers to develop a program to prepare Wyoming residents to work as construction managers.
Table 1 also shows that of the 127 aircraft mechanics & service technician new hires during this two-year period, 36.4% (46) were nonresidents. In addition, only 18.2% of employers indicated that they were satisfied with their new hires’ skills for this occupation, and only 54.5% of the new hires in this occupation were still working for the same employer one quarter after hire.
Career Paths
The New Hires Survey data also complements other published products from R&P to help job seekers identify career paths. For example, college students pursuing a teaching degree can use this information to identify which types of teachers Wyoming employers are hiring.
|
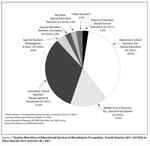
Figure 2 was created using New Hires Survey data, and shows the distribution of new hires in teaching occupations in educational services in Wyoming. Of the estimated 947 teacher new hires from 2011Q4 to 2013Q3, 36.9% (349) were elementary school teachers, except special education, and 32.9% (312) were secondary school teachers, except special & vocational education. An additional 15.8% (150) were middle school teachers, except special & vocational education.
The distribution of new hires in teaching occupations in educational services is similar to the distribution of all teachers employed in public schools in Wyoming as published in Monitoring School District Human Resources Cost Pressures. A Research & Planning analysis of Wyoming Department of Education (WDE) Contract Files obtained through a memorandum of understanding with WDE indicates that of the 7,443 teachers working in public schools in Wyoming during the 2012/13 school year, 28.9% (2,148) were elementary school teachers, 25.9% (1,927) were secondary school teachers, except special & vocational education; and 17.0% were middle school teachers, except special & vocational education (Bullard, 2013).
Note that the WDE Contract Files data from Monitoring represent a count of teachers working only in public schools in Wyoming, while the New Hires Survey data presented in this article provide estimates of new hires working in the educational services industry, and are not limited to just public schools. Even so, understanding and comparing the data from these sources can help students and jobseekers better understand the labor market for teachers in Wyoming.
Monitoring showed that 2,148 elementary school teachers made up the largest proportion (28.9%) of the 7,443 teachers in public schools in Wyoming in the 2012/13 school year. Of those 2,148 elementary school teachers, 21.6% (464) were age 55 or older, meaning they will reach the traditional retirement age of 65 within the next 10 years. New Hires Survey data show that the 349 new hires classified as elementary school teachers also accounted for the highest percentage (36.9%) of all teacher new hires in Wyoming’s educational services industry. Some of this exit and hiring activity may be due to older teachers retiring from the labor force, and employers hiring younger teachers to take their places.
Summary
Data collected through R&P’s New Hires Survey provide a rich level of detail not previously available from other surveys or administrative databases. This article showed just two of the many uses for these data that can benefit employers, educators, training providers, jobseekers, policymakers, and others. Full results from the New Hires Survey dating back to 2009Q4 can be found online at http://doe.state.wy.us/LMI/newhires.htm. For more information, contact New Hires Survey administrator Lisa Knapp at (307) 473-3835 or lisa.knapp@wyo.gov.
References
Bullard, D. (2011). Detailed covered employment and wages for second quarter 2010: growth in total payroll resumes. Wyoming Labor Force Trends, 48(1). Retrieved July 16, 2014, from http://doe.state.wy.us/lmi/0111/a1.htm
Bullard, D. (2013). Impending retirement trends. In Monitoring School District Human Resource Cost Pressures 2013 (p. 54). Casper, WY: Research & Planning, Wyoming Department of Workforce Services. Retrieved June 30, 2014, from http://doe.state.wy.us/LMI/education_costs/2013/monitoring_2013.pdf
Jones, S. (2002). Defining residency for the Wyoming workforce. Wyoming Labor Force Trends, 39(11). Retrieved May 23, 2013, from http://doe.state.wy.us/LMI/1102/a1.htm
Knapp, L. (2011). Survey captures data on Wyoming new hires. Wyoming Labor Force Trends, 48(2). Retrieved March 5, 2014, from http://doe.state.wy.us/LMI/0211/a2.htm