
 Detailed Covered Employment and Wages for Fourth Quarter 2010: Job Gains and Payroll Growth Indicate
Economic Recovery
Detailed Covered Employment and Wages for Fourth Quarter 2010: Job Gains and Payroll Growth Indicate
Economic Recovery
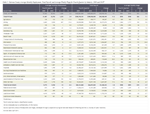
In fourth quarter 2010, for the first time in nearly two years, Unemployment Insurance (UI) covered employment increased noticeably (up 2,918 jobs, or 1.1% from fourth quarter 2009). Additionally, total payroll increased by $174.5 million (6.0%). UI covered payroll represents approximately 91% of all wage and salary
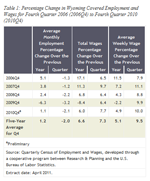 |
disbursements and 43% of personal income in the state (U.S. Bureau of Economic Analysis, 2011). Job growth (1.1%) and payroll growth (6.0%) were very similar to their five-year averages (1.2% and 6.6%, respectively; see Table 1), suggesting that the state's economy was recovering. As in third quarter, the largest number of new jobs and the greatest growth in total payroll occurred in the mining sector (including oil & gas). On an annual average basis, employment fell by approximately 3,700 jobs (-1.3%) from 2009 to 2010. This decrease was much smaller than the job losses which occurred between 2008 and 2009 (approximately -11,600 jobs, or -4.0%). Analysts have noted that "minerals related employment is one of the key predictors of sales and use tax income" in Wyoming (CREG 2010).
The covered payroll and employment data in this article are tabulated by place of work, in contrast to the labor force estimates (see related article) which are a measure of employed and unemployed persons by place of residence. Also, the employment data presented in this article represent a count of jobs, not persons. When individuals work more than one job, each is counted separately. Finally, job growth (or decline) is stated in terms of net change. The Quarterly Turnover Statistics by Industry table presents alternative measures of job gains and losses.
The purpose of this article is to show employment and payroll changes between fourth quarter 2009 and fourth quarter 2010. These economic changes help gauge the overall strength of Wyoming's economy and identify the fastest and slowest growing sectors and geographic areas.
Job growth increased from 0.0% in third quarter to 1.1% in fourth
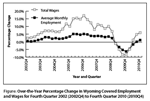 |
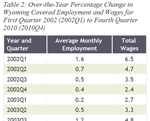
quarter and payroll growth rose from 4.8% to 6.0% (see Figure). Although a 1.1% increase in employment is modest compared to growth rates that prevailed from 2004-2008, it represents steady improvement in Wyoming's labor market (see Table 2). The increase in
 |
total payroll similarly suggests that the state's economy is recovering at a moderate pace.
Employment and Wages by County
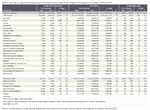
Employment increased in 15 counties and decreased in 8 (see Table 3). Many of the fastest growing counties were impacted by job growth in the mining sector (including oil & gas). Total payroll rose in 20 counties and fell in 3.
Sweetwater County gained 1,187 jobs (5.1%) and its total payroll increased by $31.5 million (10.4%). Construction employment rose by more than 400 jobs and mining (including oil & gas) added more than 350 jobs. Growth was also seen in administrative & waste services, local government (including public schools & colleges), transportation & warehousing, and accommodation & food services.
Fremont County added 497 jobs (3.0%) and its total payroll rose by $12.2 million (8.1%). Job gains were seen in mining (including oil & gas), construction, educational services, health care & social assistance, and local government.
Uinta County's employment increased by 390 jobs (4.2%) and its total payroll rose by $18.3 million (18.6%). It appears that the Ruby Pipeline project had a large impact on the county as the construction sector added approximately 450 jobs. Smaller job gains were seen in manufacturing, transportation & warehousing, professional & technical services, and local government. Job losses were noted in mining (including oil & gas) and retail trade.
Platte County added 127 jobs (3.8%) and its total payroll grew by $3.0 million (9.8%). Modest job gains occurred in agriculture, mining, and construction.
Campbell County added 101 jobs (0.4%) and its total payroll increased by $35.9 million (9.3%). Job gains were seen in mining (including oil & gas; more than 300 jobs) and local government (including public schools, colleges, & hospitals; approximately 200 jobs). Despite job gains associated with work on the Bison Pipeline, overall construction employment fell by approximately 200 jobs.
Albany County lost 505 jobs (-3.2%) and its total payroll fell by $3.1 million (-2.2%). State government and construction each lost approximately 200 jobs. More modest job losses occurred in federal government, local government, and manufacturing.
Teton County's employment fell by 291 jobs (-1.8%), but its total payroll increased by $5.9 million (3.6%). Job gains in accommodation & food services (approximately 120 jobs) were more than offset by job losses in construction (approximately 320 jobs).
Converse County employment decreased by 74 jobs (-1.3%) and its total payroll fell by $3.1 million (-4.8%). Mining (including oil & gas) added approximately 200 jobs. Construction lost more than 350 jobs.
Lincoln County lost 51 jobs (-0.8%), but its total payroll increased by $4.5 million (7.4%). Employment decreased slightly in retail trade, local government, and manufacturing.
Natrona County gained 1,200 jobs (3.2%) and its total payroll grew by $38.9 million (9.1%). Mining (including oil & gas) added 847 jobs (31.6%) and its total payroll increased by $24.3 million (44.5%). Notable job growth was also seen in accommodation & food services (192 jobs, or 5.8%), other services (159 jobs, or 9.8%), health care & social assistance (137 jobs, or 2.5%), and manufacturing (127 jobs, or 8.2%). Retail trade posted large job losses (-419 jobs, or -8.1%) and its total payroll also decreased (-$3.5 million, or -9.6%).
Laramie County lost 170 jobs (-0.4%) while its total payroll increased by $4.9 million (1.1%). The largest job losses occurred in construction (-349 jobs, or -12.4%), manufacturing (-61 jobs, or - 4.1%), and finance & insurance (-61 jobs, or -3.6%). Job gains were seen in
Online Only
 |
 |
transportation & warehousing (179 jobs, or 8.5%), local government (102 jobs, or 1.4%), and retail trade (77 jobs, or 1.4%).
Detailed tables for Natrona and Laramie counties are available online.
Statewide Employment and Wages by Industry
 |
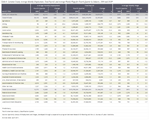
When viewed from an industry perspective, the largest job gains occurred in mining (including oil & gas), accommodation & food services, local government (including public schools, colleges, & hospitals), transportation & warehousing, health care & social assistance, and administrative & waste services (see Table 4). Employment fell in retail trade, construction, and finance & insurance.
Mining employment (including oil & gas) increased by 2,000 jobs (8.3%) and its total payroll grew by $73.8 million (16.1%). Oil & gas extraction added approximately 200 jobs, mining, except oil & gas added approximately 200 jobs, and support activities for mining added more than 1,600 jobs.
Accommodation & food services added 591 jobs (2.1%) and its total payroll increased by $5.9 million (5.2%). The largest job gains were found in food services & drinking places (approximately 500 jobs) while employment increased modestly in accommodation.
Local government grew by 429 jobs (0.9%) and its total payroll increased by $6.2 million (1.3%). Most of the growth occurred in local government education (including public schools & colleges) which added 251 jobs (1.0%). Employment also increased slightly in public hospitals (54 jobs, or 0.8%).
Transportation & warehousing gained 415 jobs (4.7%) and its total payroll rose by $11.4 million (11.6%). The vast majority of job gains (more than 350) occurred in truck transportation, but employment also increased in couriers & messengers and warehousing & storage. Employment decreased slightly in air transportation and pipeline transportation.
Health care & social assistance added 319 jobs (1.4%) and its total payroll grew by $6.9 million (2.8%). Ambulatory health care services gained 237 jobs (2.8%) and smaller gains were seen in hospitals (27 jobs, or 0.8%) and social assistance (46 jobs, or 0.7%). Employment rose by 253 jobs (3.6%) in administrative & waste services and its total payroll increased by $2.9 million (5.7%). Employment services (including temporary help agencies) added approximately 250 jobs, while waste management & remediation services added more than 100 jobs. Job losses were seen in business support services (including call centers) and other support services.
Retail trade lost 773 jobs (-2.6%) and its total payroll fell by $3.0 million (-1.5%). Notable job losses were seen in food & beverage stores (approximately 250 jobs), nonstore retailers (including Internet & catalog retailers; approximately 250 jobs), general merchandise stores (including warehouse clubs & supercenters; approximately 200 jobs), and miscellaneous store retailers (approximately 100 jobs). Employment increased slightly in electronics & appliance stores and clothing & clothing accessories stores.
Construction employment fell by 717 jobs (-3.1%), but its total payroll grew by $17.4 million (6.1%). Construction of buildings lost approximately 450 jobs and specialty trade contractors lost approximately 550 jobs, but heavy & civil engineering construction gained approximately 300 jobs. Especially strong growth was noted in oil & gas pipeline & related structures construction, as work was under way on two separate pipeline projects in the state.
Finance & insurance lost 243 jobs (-3.5%), but its total payroll rose by $2.3 million (2.6%). The majority of job losses were in credit intermediation & related activities (including banks & credit unions; more than 150 jobs). Job losses also occurred in insurance carriers & related activities (more than 50 jobs).
In summary, for the first time in nearly two years, employment increased substantially and total payroll growth accelerated. Growth was seen in most counties and in most industry sectors, with the largest job gains found in the mining (including oil & gas) sector.
References
Consensus Revenue Estimating Group (CREG). (2010, October). Wyoming state government revenue forecast fiscal year 2011-fiscal year 2016. Retrieved February 17, 2011 from http://eadiv.state.wy.us/creg/GreenCREG_Oct10.pdf
U.S. Bureau of Economic Analysis. (2011, March 16). SA04 State income and employment summary — Wyoming. Retrieved March 16, 2011, from http://www.bea.gov/regional/spi/default.cfm
U.S. Census Bureau. (2007, August 28). 2007 NAICS codes and titles. Retrieved March 16, 2011, from http://www.census.gov/naics/2007/NAICOD07.HTM