
| Average Monthly Employment Percentage Change Over the Previous | Total Wages Percentage Change Over the Previous | Average Weekly Wage Percentage Change Over the Previous | ||||
|---|---|---|---|---|---|---|
| Year | Quarter | Year | Quarter | Year | Quarter | |
| 2006Q4 | 5.1 | -1.3 | 17.1 | 6.5 | 11.5 | 7.9 |
| 2007Q4 | 3.8 | -1.2 | 11.3 | 9.7 | 7.2 | 11.1 |
| 2008Q4 | 2.4 | -2.2 | 6.8 | 6.4 | 4.3 | 8.8 |
| 2009Q4 | -6.3 | -3.2 | -8.4 | 6.4 | -2.2 | 9.9 |
| 2010Q4a | 1.1 | -2.1 | 6.0 | 7.7 | 4.9 | 10.0 |
| Five-Year Average for Q4 | 1.2 | -2.0 | 6.6 | 7.3 | 5.1 | 9.5 |
| aPreliminary | ||||||
| Source: Quarterly Census of Employment and Wages, developed through a cooperative program between Research & Planning and the U.S. Bureau of Labor Statistics. | ||||||
| Extract date: April 2011. | ||||||
| Year and Quarter | Average Monthly Employment | Total Wages |
|---|---|---|
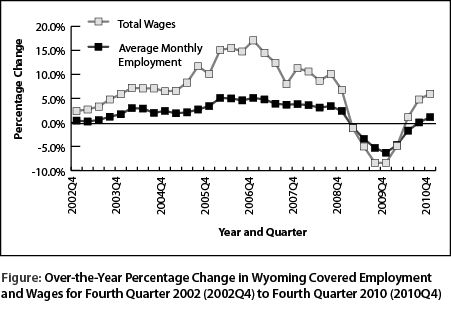
| 2002Q1 | 1.6 | 6.5 |
| 2002Q2 | 0.7 | 4.7 |
| 2002Q3 | 0.5 | 3.5 |
| 2002Q4 | 0.4 | 2.4 |
| 2003Q1 | 0.2 | 2.7 |
| 2003Q2 | 0.5 | 3.3 |
| 2003Q3 | 1.2 | 4.8 |
| 2003Q4 | 1.7 | 5.9 |
| 2004Q1 | 3.0 | 7.2 |
| 2004Q2 | 2.9 | 7.1 |
| 2004Q3 | 2.0 | 7.1 |
| 2004Q4 | 2.4 | 6.5 |
| 2005Q1 | 1.9 | 6.6 |
| 2005Q2 | 2.1 | 8.3 |
| 2005Q3 | 2.7 | 11.7 |
| 2005Q4 | 3.4 | 10.1 |
| 2006Q1 | 5.1 | 15.1 |
| 2006Q2 | 5.0 | 15.5 |
| 2006Q3 | 4.6 | 14.8 |
| 2006Q4 | 5.1 | 17.1 |
| 2007Q1 | 4.8 | 14.5 |
| 2007Q2 | 3.9 | 12.4 |
| 2007Q3 | 3.7 | 8.0 |
| 2007Q4 | 3.8 | 11.3 |
| 2008Q1 | 3.6 | 10.6 |
| 2008Q2 | 3.1 | 8.7 |
| 2008Q3 | 3.4 | 10.1 |
| 2008Q4 | 2.4 | 6.8 |
| 2009Q1 | -1.0 | -1.2 |
| 2009Q2 | -3.4 | -5.0 |
| 2009Q3 | -5.3 | -8.4 |
| 2009Q4 | -6.3 | -8.4 |
| 2010Q1 | -4.7 | -4.9 |
| 2010Q2 | -1.7 | 1.1 |
| 2010Q3 | 0.0 | 4.8 |
| 2010Q4a | 1.1 | 6.0 |
| aPreliminary. | ||
| Source: Quarterly Census of Employment and Wages, developed through a cooperative program between Research & Planning and the U.S. Bureau of Labor Statistics. | ||
| Extract date: April 2011. | ||
| Average Monthly Employment | Total Payroll | Average Weekly Wage | ||||||||||
|---|---|---|---|---|---|---|---|---|---|---|---|---|
| County | Fourth Quarter | Change | Fourth Quarter | Change | Fourth Quarter | Change | ||||||
| 2009 | 2010 | n | % | 2009 | 2010 | $ | % | 2009 | 2010 | $ | % | |
| Total | 269,439 | 272,357 | 2,918 | 1.1 | $2,911,594,084 | $3,086,136,830 | $174,542,746 | 6.0 | $831 | $872 | $40 | 4.9 |
| Albany | 15,818 | 15,313 | -505 | -3.2 | $143,761,185 | $140,668,923 | -$3,092,262 | -2.2 | $699 | $707 | $8 | 1.1 |
| Big Horn | 4,158 | 4,202 | 44 | 1.1 | 36,811,061 | 40,369,227 | 3,558,166 | 9.7 | 681 | 739 | 58 | 8.5 |
| Campbell | 28,364 | 28,465 | 101 | 0.4 | 386,234,681 | 422,175,825 | 35,941,144 | 9.3 | 1,047 | 1,141 | 94 | 9.0 |
| Carbon | 6,695 | 6,696 | 1 | 0.0 | 67,150,369 | 69,934,360 | 2,783,991 | 4.1 | 772 | 803 | 31 | 4.0 |
| Converse | 5,483 | 5,409 | -74 | -1.3 | 63,813,745 | 60,719,059 | -3,094,686 | -4.8 | 895 | 864 | -31 | -3.5 |
| Crook | 2,301 | 2,325 | 24 | 1.0 | 20,896,657 | 21,655,117 | 758,460 | 3.6 | 699 | 716 | 17 | 2.4 |
| Fremont | 16,297 | 16,794 | 497 | 3.0 | 150,803,718 | 163,033,052 | 12,229,334 | 8.1 | 712 | 747 | 35 | 4.9 |
| Goshen | 4,669 | 4,644 | -25 | -0.5 | 36,469,843 | 37,596,494 | 1,126,651 | 3.1 | 601 | 623 | 22 | 3.7 |
| Hot Springs | 2,076 | 2,110 | 34 | 1.6 | 16,137,505 | 17,940,272 | 1,802,767 | 11.2 | 598 | 654 | 56 | 9.4 |
| Johnson | 3,249 | 3,345 | 96 | 3.0 | 26,669,135 | 28,221,478 | 1,552,343 | 5.8 | 631 | 649 | 18 | 2.9 |
| Laramie | 42,883 | 42,713 | -170 | -0.4 | 433,407,413 | 438,281,484 | 4,874,071 | 1.1 | 777 | 789 | 12 | 1.5 |
| Lincoln | 6,146 | 6,095 | -51 | -0.8 | 61,058,225 | 65,588,822 | 4,530,597 | 7.4 | 764 | 828 | 64 | 8.4 |
| Natrona | 37,262 | 38,462 | 1,200 | 3.2 | 426,861,969 | 465,802,075 | 38,940,106 | 9.1 | 881 | 932 | 51 | 5.8 |
| Niobrara | 908 | 873 | -35 | -3.9 | 6,910,776 | 6,851,084 | -59,692 | -0.9 | 585 | 604 | 19 | 3.2 |
| Park | 12,726 | 12,814 | 88 | 0.7 | 118,553,232 | 124,377,522 | 5,824,290 | 4.9 | 717 | 747 | 30 | 4.2 |
| Platte | 3,342 | 3,469 | 127 | 3.8 | 30,471,665 | 33,467,431 | 2,995,766 | 9.8 | 701 | 742 | 41 | 5.8 |
| Sheridan | 12,986 | 12,953 | -33 | -0.3 | 130,870,526 | 130,933,677 | 63,151 | 0.0 | 775 | 778 | 3 | 0.4 |
| Sublette | 5,424 | 5,631 | 207 | 3.8 | 77,633,163 | 83,764,422 | 6,131,259 | 7.9 | 1,101 | 1,144 | 43 | 3.9 |
| Sweetwater | 23,049 | 24,236 | 1,187 | 5.1 | 302,458,177 | 333,947,706 | 31,489,529 | 10.4 | 1,009 | 1,060 | 51 | 5.1 |
| Teton | 15,813 | 15,522 | -291 | -1.8 | 165,638,935 | 171,586,332 | 5,947,397 | 3.6 | 806 | 850 | 44 | 5.5 |
| Uinta | 9,378 | 9,768 | 390 | 4.2 | 98,050,744 | 116,322,498 | 18,271,754 | 18.6 | 804 | 916 | 112 | 13.9 |
| Washakie | 4,000 | 4,015 | 15 | 0.4 | 36,476,846 | 37,803,112 | 1,326,266 | 3.6 | 701 | 724 | 23 | 3.3 |
| Weston | 2,271 | 2,322 | 51 | 2.2 | 19,303,592 | 21,040,700 | 1,737,108 | 9.0 | 654 | 697 | 43 | 6.6 |
| Nonclassifiedb | 4,141 | 4,182 | 41 | 1.0 | 55,150,922 | 54,056,158 | -1,094,764 | -2.0 | 1,025 | 994 | -30 | -2.9 |
| aPreliminary. | ||||||||||||
| bThe employer may be located statewide or in more than one county. | ||||||||||||
| Source: Quarterly Census of Employment and Wages, developed through a cooperative program between Research & Planning and the U.S. Bureau of Labor Statistics. | ||||||||||||
| Extract date: April 2011. | ||||||||||||
| Average Monthly Employment | Total Payroll | Average Weekly Wage | ||||||||||
|---|---|---|---|---|---|---|---|---|---|---|---|---|
| Fourth Quarter | Change | Fourth Quarter | Change | Fourth Quarter | Change | |||||||
| NAICSb Title | 2009 | 2010 | n | % | 2009 | 2010 | $ | % | 2009 | 2010 | $ | % |
| Total, All Industries | 269,439 | 272,357 | 2,918 | 1.1 | $2,911,594,084 | $3,086,136,830 | $174,542,746 | 6.0 | $831 | $872 | $41 | 4.9 |
| Total Private | 202,969 | 205,465 | 2,496 | 1.2 | $2,172,476,622 | $2,336,463,772 | $163,987,150 | 7.5 | $823 | $875 | $52 | 6.3 |
| Agriculture | 2,350 | 2,362 | 12 | 0.5 | 18,455,789 | 20,006,319 | 1,550,530 | 8.4 | 604 | 652 | 48 | 7.9 |
| Mining | 24,125 | 26,125 | 2,000 | 8.3 | 458,821,228 | 532,666,764 | 73,845,536 | 16.1 | 1,463 | 1,568 | 105 | 7.2 |
| Utilities | 2,470 | 2,495 | 25 | 1.0 | 53,116,258 | 54,394,276 | 1,278,018 | 2.4 | 1,654 | 1,677 | 23 | 1.4 |
| Construction | 23,231 | 22,514 | -717 | -3.1 | 285,990,736 | 303,353,198 | 17,362,462 | 6.1 | 947 | 1,036 | 89 | 9.4 |
| Manufacturing | 9,109 | 9,104 | -5 | -0.1 | 121,048,854 | 125,127,960 | 4,079,106 | 3.4 | 1,022 | 1,057 | 35 | 3.4 |
| Wholesale Trade | 8,391 | 8,519 | 128 | 1.5 | 121,650,699 | 133,632,165 | 11,981,466 | 9.8 | 1,115 | 1,207 | 92 | 8.3 |
| Retail Trade | 30,254 | 29,481 | -773 | -2.6 | 199,067,962 | 196,107,407 | -2,960,555 | -1.5 | 506 | 512 | 6 | 1.2 |
| Transportation & Warehousing | 8,741 | 9,156 | 415 | 4.7 | 99,032,069 | 110,478,103 | 11,446,034 | 11.6 | 872 | 928 | 56 | 6.4 |
| Information | 3,882 | 3,836 | -46 | -1.2 | 38,440,956 | 41,764,566 | 3,323,610 | 8.6 | 762 | 838 | 76 | 10.0 |
| Finance & Insurance | 7,024 | 6,781 | -243 | -3.5 | 86,344,702 | 88,597,725 | 2,253,023 | 2.6 | 946 | 1,005 | 59 | 6.2 |
| Real Estate & Rental & Leasing | 3,906 | 3,973 | 67 | 1.7 | 38,634,036 | 44,439,376 | 5,805,340 | 15.0 | 761 | 860 | 99 | 13.0 |
| Professional & Technical Services | 8,998 | 9,071 | 73 | 0.8 | 136,986,195 | 143,931,157 | 6,944,962 | 5.1 | 1,171 | 1,221 | 50 | 4.3 |
| Mgmt. of Companies & Enterprises | 773 | 849 | 76 | 9.8 | 16,437,387 | 20,115,484 | 3,678,097 | 22.4 | 1,636 | 1,823 | 187 | 11.4 |
| Administrative & Waste Services | 6,959 | 7,212 | 253 | 3.6 | 51,728,906 | 54,670,113 | 2,941,207 | 5.7 | 572 | 583 | 11 | 1.9 |
| Educational Services | 1,696 | 1,863 | 167 | 9.8 | 11,776,195 | 13,041,876 | 1,265,681 | 10.7 | 534 | 538 | 4 | 0.7 |
| Health Care & Social Assistance | 23,153 | 23,472 | 319 | 1.4 | 246,543,772 | 253,487,667 | 6,943,895 | 2.8 | 819 | 831 | 12 | 1.5 |
| Ambulatory Health Care Services | 8,564 | 8,801 | 237 | 2.8 | 136,811,120 | 142,071,247 | 5,260,127 | 3.8 | 1,229 | 1,242 | 13 | 1.1 |
| Hospitals | 3,307 | 3,334 | 27 | 0.8 | 42,777,692 | 43,463,980 | 686,288 | 1.6 | 995 | 1,003 | 8 | 0.8 |
| Nursing & Residential Care Facilities | 4,545 | 4,554 | 9 | 0.2 | 31,820,493 | 32,541,778 | 721,285 | 2.3 | 539 | 550 | 11 | 2.0 |
| Social Assistance | 6,737 | 6,783 | 46 | 0.7 | 35,134,467 | 35,410,662 | 276,195 | 0.8 | 401 | 402 | 1 | 0.2 |
| Arts, Entertainment, & Recreation | 2,381 | 2,316 | -65 | -2.7 | 11,487,374 | 12,242,735 | 755,361 | 6.6 | 371 | 407 | 36 | 9.7 |
| Accommodation & Food Services | 27,754 | 28,345 | 591 | 2.1 | 113,900,534 | 119,768,724 | 5,868,190 | 5.2 | 316 | 325 | 9 | 2.8 |
| Other Services | 7,773 | 7,991 | 218 | 2.8 | 63,012,970 | 68,638,157 | 5,625,187 | 8.9 | 624 | 661 | 37 | 5.9 |
| Total Government | 66,470 | 66,891 | 421 | 0.6 | $739,117,462 | $749,673,058 | $10,555,596 | 1.4 | $855 | $862 | $7 | 0.8 |
| Federal Government | 7,398 | 7,429 | 31 | 0.4 | 116,423,239 | 116,609,905 | 186,666 | 0.2 | 1,211 | 1,207 | -4 | -0.3 |
| State Government | 13,283 | 13,244 | -39 | -0.3 | 164,703,436 | 168,903,522 | 4,200,086 | 2.6 | 954 | 981 | 27 | 2.8 |
| State Government Education | 3,829 | 3,602 | -227 | -5.9 | 44,914,701 | 44,886,520 | -28,181 | -0.1 | 902 | 958 | 56 | 6.2 |
| Local Government | 45,789 | 46,218 | 429 | 0.9 | 457,990,787 | 464,159,631 | 6,168,844 | 1.3 | 769 | 773 | 4 | 0.5 |
| Local Government Education | 24,282 | 24,533 | 251 | 1.0 | 235,716,658 | 237,617,150 | 1,900,492 | 0.8 | 747 | 745 | -2 | -0.2 |
| Hospitals | 6,553 | 6,607 | 54 | 0.8 | 81,147,189 | 87,085,015 | 5,937,826 | 7.3 | 953 | 1,014 | 61 | 6.4 |
| aPreliminary. | ||||||||||||
| bNorth American Industry Classification System. | ||||||||||||
| Source: Quarterly Census of Employment and Wages, developed through a cooperative program between Research & Planning and the U.S. Bureau of Labor Statistics. | ||||||||||||
| Extract date: April 2011. | ||||||||||||
| Average Monthly Employment | Total Payroll | Average Weekly Wage | ||||||||||
|---|---|---|---|---|---|---|---|---|---|---|---|---|
| NAICSb Title | Fourth Quarter | Change | Fourth Quarter | Change | Fourth Quarter | Change | ||||||
| 2009 | 2010 | n | % | 2009 | 2010 | $ | % | 2009 | 2010 | $ | % | |
| Total, All Industries | 37,262 | 38,462 | 1,200 | 3.2 | $426,861,969 | $465,802,075 | $38,940,106 | 9.1 | $881 | $932 | $51 | 5.8 |
| Total Private | 31,487 | 32,702 | 1,215 | 3.9 | $358,740,101 | $398,928,550 | $40,188,449 | 11.2 | $876 | $938 | $62 | 7.1 |
| Agriculture | 139 | 123 | -16 | -11.5 | 920,004 | 830,717 | -89,287 | -9.7 | 509 | 520 | 11 | 2.2 |
| Mining | 2,683 | 3,530 | 847 | 31.6 | 54,538,058 | 78,811,532 | 24,273,474 | 44.5 | 1,564 | 1,717 | 153 | 9.8 |
| Utilities | 125 | 126 | 1 | 0.8 | 3,179,291 | 3,245,735 | 66,444 | 2 | 1,956 | 1,982 | 26 | 1 |
| Construction | 2,651 | 2,620 | -31 | -1.2 | 36,203,006 | 36,208,369 | 5,363 | 0.0 | 1,050 | 1,063 | 13 | 1.2 |
| Manufacturing | 1,554 | 1,681 | 127 | 8.2 | 18,970,795 | 21,586,680 | 2,615,885 | 13.8 | 939 | 988 | 49 | 5.2 |
| Wholesale Trade | 2,327 | 2,367 | 40 | 1.7 | 37,044,484 | 39,757,704 | 2,713,220 | 7.3 | 1,225 | 1,292 | 67 | 5.5 |
| Retail Trade | 5,144 | 4,725 | -419 | -8.1 | 36,474,232 | 32,987,621 | -3,486,611 | -9.6 | 545 | 537 | -8 | -1.5 |
| Transportation & Warehousing | 928 | 984 | 56 | 6.0 | 11,218,621 | 13,201,072 | 1,982,451 | 17.7 | 930 | 1,032 | 102 | 11.0 |
| Information | 488 | 483 | -5 | -1.0 | 4,477,273 | 5,514,160 | 1,036,887 | 23.2 | 706 | 878 | 172 | 24.4 |
| Finance & Insurance | 1,036 | 1,015 | -21 | -2.0 | 13,541,245 | 14,182,294 | 641,049 | 4.7 | 1,005 | 1,075 | 70 | 7.0 |
| Real Estate & Rental & Leasing | 862 | 868 | 6 | 0.7 | 9,208,333 | 10,232,264 | 1,023,931 | 11.1 | 822 | 907 | 85 | 10.3 |
| Professional & Technical Services | 1,396 | 1,399 | 3 | 0.2 | 22,318,312 | 23,243,449 | 925,137 | 4.1 | 1,230 | 1,278 | 48 | 3.9 |
| Mgmt. of Companies & Enterprises | 112 | 154 | 42 | 37.5 | 2,351,609 | 3,296,072 | 944,463 | 40 | 1,615 | 1,646 | 31 | 1.9 |
| Administrative & Waste Services | 1,139 | 1,227 | 88 | 7.7 | 8,272,128 | 9,231,639 | 959,511 | 11.6 | 559 | 579 | 20 | 3.6 |
| Educational Services | 120 | 133 | 13 | 10.8 | 548,443 | 659,091 | 110,648 | 20.2 | 352 | 381 | 29 | 8.2 |
| Health Care & Social Assistance | 5,449 | 5,586 | 137 | 2.5 | 69,739,697 | 72,863,035 | 3,123,338 | 4.5 | 985 | 1,003 | 18 | 1.8 |
| Ambulatory Health Care Services | 1,830 | 1,857 | 27 | 1.5 | 34,820,740 | 35,916,816 | 1,096,076 | 3.1 | 1,464 | 1,488 | 24 | 1.6 |
| Hospitals | 1,692 | 1,759 | 67 | 4.0 | 22,486,267 | 24,124,166 | 1,637,899 | 7.3 | 1,022 | 1,055 | 33 | 3.2 |
| Nursing & Residential Care Facilities | 948 | 957 | 9 | 0.9 | 7,409,472 | 7,484,028 | 74,556 | 1.0 | 601 | 602 | 1 | 0.2 |
| Social assistance | 979 | 1,012 | 33 | 3.4 | 5,023,218 | 5,338,025 | 314,807 | 6.3 | 395 | 406 | 11 | 2.8 |
| Arts, Entertainment, & Recreation | 384 | 377 | -7 | -1.8 | 1,555,800 | 1,611,688 | 55,888 | 3.6 | 312 | 329 | 17 | 5.4 |
| Accommodation & Food Services | 3,333 | 3,525 | 192 | 5.8 | 12,754,519 | 13,393,680 | 639,161 | 5.0 | 294 | 292 | -2 | -0.7 |
| Other Services | 1,619 | 1,778 | 159 | 9.8 | 15,424,251 | 18,071,748 | 2,647,497 | 17.2 | 733 | 782 | 49 | 6.7 |
| Total Government | 5,774 | 5,760 | -14 | -0.2 | $68,121,868 | $66,873,525 | -$1,248,343 | -1.8 | $908 | $893 | -$15 | -1.7 |
| Federal Government | 673 | 691 | 18 | 2.7 | 11,836,314 | 12,101,280 | 264,966 | 2.2 | 1,353 | 1,347 | -6 | -0.4 |
| State Government | 687 | 699 | 12 | 1.7 | 8,919,826 | 9,138,832 | 219,006 | 2.5 | 999 | 1,006 | 7 | 0.7 |
| Local Government | 4,415 | 4,370 | -45 | -1.0 | 47,365,728 | 45,633,413 | -1,732,315 | -3.7 | 825 | 803 | -22 | -2.7 |
| Local Government Education | ND | ND | ND | ND | ND | ND | ND | ND | ND | ND | ND | ND |
| aPreliminary. | ||||||||||||
| bNorth American Industry Classification System. | ||||||||||||
| ND-Not disclosable due to confidentiality of information. | ||||||||||||
| Source: Quarterly Census of Employment and Wages, developed through a cooperative program between Research & Planning and the U.S. Bureau of Labor Statistics. | ||||||||||||
| Extract date: April 2011. | ||||||||||||
| Average Monthly Employment | Total Payroll | Average Weekly Wage | ||||||||||
|---|---|---|---|---|---|---|---|---|---|---|---|---|
| NAICSb Title | Fourth Quarter | Change | Fourth Quarter | Change | Fourth Quarter | Change | ||||||
| 2009 | 2010 | n | % | 2009 | 2010 | $ | % | 2009 | 2010 | $ | % | |
| Total, All Industries | 42,883 | 42,713 | -170 | -0.4 | $433,407,413 | $438,281,484 | $4,874,071 | 1.1 | $777 | $789 | $12 | 1.5 |
| Total Private | 29,110 | 28,888 | -222 | -0.8 | $259,612,169 | $263,319,970 | $3,707,801 | 1.4 | $686 | $701 | $15 | 2.2 |
| Agriculture | 281 | 269 | -12 | -4.3 | 2,072,685 | 2,059,103 | -13,582 | -0.7 | 567 | 589 | 22 | 3.9 |
| Mining | 90 | 67 | -23 | -25.6 | 1,256,566 | 1,049,787 | -206,779 | -16.5 | 1,074 | 1,205 | 131 | 12.2 |
| Utilities | 131 | 140 | 9 | 6.9 | 2,385,691 | 2,462,712 | 77,021 | 3.2 | 1,401 | 1,353 | -48 | -3.4 |
| Construction | 2,824 | 2,475 | -349 | -12.4 | 30,671,493 | 26,879,697 | -3,791,796 | -12.4 | 835 | 835 | 0 | 0.0 |
| Manufacturing | 1,470 | 1,409 | -61 | -4.1 | 18,972,527 | 19,311,696 | 339,169 | 1.8 | 993 | 1,054 | 61 | 6.1 |
| Wholesale Trade | 836 | 811 | -25 | -3.0 | 10,928,090 | 10,567,118 | -360,972 | -3.3 | 1,006 | 1,002 | -4 | -0.4 |
| Retail Trade | 5,315 | 5,392 | 77 | 1.4 | 34,096,163 | 34,425,414 | 329,251 | 1.0 | 493 | 491 | -2 | -0.4 |
| Transportation & Warehousing | 2,113 | 2,292 | 179 | 8.5 | 20,646,421 | 22,793,702 | 2,147,281 | 10.4 | 752 | 765 | 13 | 1.7 |
| Information | 1,079 | 1,073 | -6 | -0.6 | 12,089,698 | 12,562,242 | 472,544 | 3.9 | 862 | 901 | 39 | 4.5 |
| Finance & Insurance | 1,709 | 1,648 | -61 | -3.6 | 20,102,571 | 20,496,131 | 393,560 | 2.0 | 905 | 957 | 52 | 5.7 |
| Real Estate & Rental & Leasing | 465 | 502 | 37 | 8.0 | 3,987,661 | 4,926,594 | 938,933 | 23.5 | 660 | 755 | 95 | 14.4 |
| Professional & Technical Services | 1,498 | 1,490 | -8 | -0.5 | 22,445,672 | 22,671,661 | 225,989 | 1.0 | 1,153 | 1,170 | 17 | 1.5 |
| Mgmt. of Companies & Enterprises | 83 | 71 | -12 | -14.5 | 1,127,424 | 989,627 | -137,797 | -12.2 | 1,045 | 1,072 | 27 | 2.6 |
| Administrative & Waste Services | 1,615 | 1,648 | 33 | 2.0 | 10,645,282 | 10,736,396 | 91,114 | 0.9 | 507 | 501 | -6 | -1.2 |
| Educational Services | 240 | 234 | -6 | -2.5 | 1,445,190 | 1,573,552 | 128,362 | 8.9 | 463 | 517 | 54 | 11.7 |
| Health Care & Social Assistance | 3,863 | 3,911 | 48 | 1.2 | 41,574,032 | 44,011,455 | 2,437,423 | 5.9 | 828 | 866 | 38 | 4.6 |
| Ambulatory Health Care Services | 1,747 | 1,816 | 69 | 3.9 | 28,948,797 | 31,206,001 | 2,257,204 | 7.8 | 1,275 | 1,322 | 47 | 3.7 |
| Nursing & Residential Care Facilties | 892 | 880 | -12 | -1.3 | 6,189,029 | 6,299,402 | 110,373 | 1.8 | 534 | 551 | 17 | 3.2 |
| Hospitals & Social Assistance | 1,224 | 1,215 | -9 | -0.7 | 6,436,206 | 6,506,052 | 69,846 | 1.1 | 404 | 412 | 8 | 2.0 |
| Arts, Entertainment, & Recreation | 259 | 241 | -18 | -6.9 | 837,935 | 846,516 | 8,581 | 1.0 | 249 | 270 | 21 | 8.4 |
| Accommodation & Food Services | 4,010 | 3,991 | -19 | -0.5 | 15,293,698 | 15,647,384 | 353,686 | 2.3 | 293 | 302 | 9 | 3.1 |
| Other Services | 1,227 | 1,226 | -1 | -0.1 | 9,033,370 | 9,309,183 | 275,813 | 3.1 | 566 | 584 | 18 | 3.2 |
| Total Government | 13,773 | 13,825 | 52 | 0.4 | $173,795,244 | $174,961,514 | $1,166,270 | 0.7 | $971 | $973 | $2 | 0.2 |
| Federal Government | 2,686 | 2,638 | -48 | -1.8 | 43,279,883 | 43,720,970 | 441,087 | 1.0 | 1,239 | 1,275 | 36 | 2.9 |
| State Government | 4,003 | 4,001 | -2 | 0.0 | 56,118,529 | 56,722,450 | 603,921 | 1.1 | 1,078 | 1,091 | 13 | 1.2 |
| Local Government | 7,084 | 7,186 | 102 | 1.4 | 74,396,832 | 74,518,094 | 121,262 | 0.2 | 808 | 798 | -10 | -1.2 |
| Local Government Education | 3,725 | 3,848 | 123 | 3.3 | 36,493,382 | 37,068,943 | 575,561 | 1.6 | 754 | 741 | -13 | -1.7 |
| aPreliminary. | ||||||||||||
| bNorth American Industry Classification System. | ||||||||||||
| Source: Quarterly Census of Employment and Wages, developed through a cooperative program between Research & Planning and the U.S. Bureau of Labor Statistics. | ||||||||||||
| Extract date: April 2011. | ||||||||||||