Wyoming Normalizeda Unemployment Insurance Statistics: Initial Claims
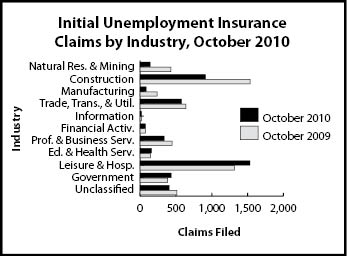
Statewide initial claims declined by 19.3% over the year and increased 74.8% over the month. Large over-the-year claims declines were observed in mining (-68.7%), manufacturing (-64.6%), and construction (-40.7%).
| Percent Change Claims Filed | |||||
| Claims Filed | Oct_10 | Oct_10 | |||
| Oct_10 | Sep_10 | Oct_09 | Sep_10 | Oct_09 | |
| Wyoming Statewide | |||||
| Total Claims Filed | 4,732 | 2,707 | 5,863 | 74.8 | -19.3 |
| Goods-Producing | 1,137 | 845 | 2,202 | 34.6 | -48.4 |
| Natural Resources and Mining | 142 | 148 | 430 | -4.1 | -67.0 |
| Mining | 120 | 140 | 383 | -14.3 | -68.7 |
| Oil & Gas Extraction | 13 | 16 | 15 | -18.8 | -13.3 |
| Construction | 911 | 624 | 1,535 | 46.0 | -40.7 |
| Manufacturing | 84 | 73 | 237 | 15.1 | -64.6 |
| Service-Providing | 2,758 | 1,294 | 2,761 | 113.1 | -0.1 |
| Trade, Transp., and Utilities | 575 | 428 | 639 | 34.3 | -10.0 |
| Wholesale Trade | 107 | 108 | 80 | -0.9 | 33.8 |
| Retail Trade | 332 | 239 | 328 | 38.9 | 1.2 |
| Transp., Warehousing & Utils. | 136 | 81 | 231 | 67.9 | -41.1 |
| Information | 18 | 16 | 18 | 12.5 | 0.0 |
| Financial Activities | 73 | 66 | 75 | 10.6 | -2.7 |
| Prof. and Business Services | 335 | 185 | 447 | 81.1 | -25.1 |
| Educational and Health Services | 158 | 154 | 145 | 2.6 | 9.0 |
| Leisure and Hospitality | 1,530 | 390 | 1,314 | 292.3 | 16.4 |
| Other Svcs., exc. Public Admin. | 69 | 55 | 123 | 25.5 | -43.9 |
| Government | 432 | 288 | 385 | 50.0 | 12.2 |
| Federal Government | 280 | 158 | 220 | 77.2 | 27.3 |
| State Government | 37 | 29 | 31 | 27.6 | 19.4 |
| Local Government | 115 | 101 | 134 | 13.9 | -14.2 |
| Local Education | 28 | 27 | 24 | 3.7 | 16.7 |
| Unclassified | 405 | 280 | 515 | 44.6 | -21.4 |
| Laramie County | |||||
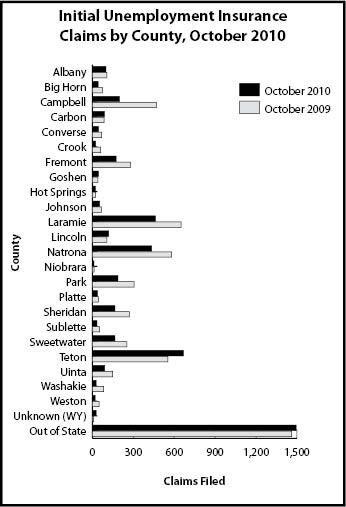
| Total Claims Filed | 461 | 403 | 647 | 14.4 | -28.7 |
| Goods-Producing | 175 | 144 | 356 | 21.5 | -50.8 |
| Construction | 155 | 120 | 294 | 29.2 | -47.3 |
| Service-Providing | 219 | 178 | 224 | 23.0 | -2.2 |
| Trade, Transp., and Utilities | 72 | 62 | 80 | 16.1 | -10.0 |
| Financial Activities | 14 | 7 | 14 | 100.0 | 0.0 |
| Prof. and Business Services | 51 | 33 | 58 | 54.5 | -12.1 |
| Educational and Health Services | 35 | 32 | 26 | 9.4 | 34.6 |
| Leisure and Hospitality | 37 | 32 | 34 | 15.6 | 8.8 |
| Government | 48 | 65 | 43 | -26.2 | 11.6 |
| Unclassified | 19 | 16 | 24 | 18.8 | -20.8 |
| Natrona County | |||||
| Total Claims Filed | 432 | 377 | 581 | 14.6 | -25.6 |
| Goods-Producing | 133 | 121 | 262 | 9.9 | -49.2 |
| Construction | 101 | 78 | 198 | 29.5 | -49.0 |
| Service-Providing | 259 | 225 | 285 | 15.1 | -9.1 |
| Trade, Transportation, and Utilities | 118 | 115 | 92 | 2.6 | 28.3 |
| Financial Activities | 8 | 9 | 8 | -11.1 | 0.0 |
| Professional and Business Services | 42 | 25 | 53 | 68.0 | -20.8 |
| Educational and Health Services | 31 | 24 | 30 | 29.2 | 3.3 |
| Leisure and Hospitality | 38 | 38 | 61 | 0.0 | -37.7 |
| Government | 29 | 26 | 21 | 11.5 | 38.1 |
| Unclassified | 11 | 5 | 13 | 120.0 | -15.4 |