Driven by Demographics: Examining Employee Exits in State Government
Wyoming's ability to retain state employees is influenced in large part by two key factors: demographics and the economy. A large percentage of workers nearing the traditional retirement age of 65 and a volatile economy driven by the energy sector can make it difficult for state government to retain employees. Over the long term, the rate of hires and exits in state government are in relative equilibrium. However, over the next 10 years, demographics will shape Wyoming's labor market like never before.
The aging of approximately 79 million U.S. Baby Boomers born between 1946 and 1965 has been a topic of conversation for many years. As of Jan. 1, 2011, the oldest members of the Baby Boom generation began turning 65, entering the traditional retirement age. Knowing this, employers must evaluate the replacement cost of turnover and recruitment (LSO, 2000). Wyoming employers, along with all other U.S. employers, are entering a decade where large scale exodus of workers across all sectors is increasingly probable.
Total employment in state government remained almost the same in relation to Wyoming's total population during the past 10 years. In both second quarter 2000 and second quarter 2010, when the decennial census was taken, total employment in state government accounted for 1.7% of Wyoming's total population. State statute 27-3-603 allows the Research & Planning (R&P) section of the Wyoming Department of Employment to collect and publish statistical analysis of executive branch employees.
This article examines how these two factors, demographics and the economy, affect Wyoming's ability to retain state employees. It also looks at past research on succession planning by R&P, demonstrating the importance of this concept as it relates to the anticipated large scale departure of state employees approaching retirement age.
Methodology
This analysis was generated by combining three administrative databases available to R&P. These include the State Auditor's Office Database, Wyoming's Unemployment Insurance (UI) Wage Records (WR) Database (including UI data compiled from nine partner states), and the Quarterly Census of Employment and Wages (QCEW) Database.
The Auditor's Database contains a record for each state employee by quarter from fourth quarter 2005 to present. Only select data elements of the auditor's database were used, which include social security number, gender, date of birth, state employee classification (occupation), and the specific state agency for which the employee works. A record was retained for each employee by quarter from 2005 to present which makes it possible to look at within-agency transitions where an employee changes occupation, as well as across agency changes where an employee leaves one state agency to work for another. For example, from the auditor's data alone a record can be produced on an individual who enters employment with the state of Wyoming for the first time, his or her career advancement to higher levels within the state agency; whether the employee changed agencies (e.g., left the Department of Employment to work for the Department of Family Services); and if he or she went to work in a neighboring state.
The second database used for the analysis is the UI Wage Records Database. Wage Records includes SSN, year, quarter, employer account number, and wages for all Unemployment Insurance covered employment in Wyoming from 1992 to present (2000 to present for partner states). Wage Records, which are also collected quarterly, make it possible to determine where persons were employed and their wages prior to, during, and subsequent to their employment with the state of Wyoming.
The last database used for the current analysis is the QCEW. The QCEW captures data that describes the characteristics of the employers for which the employees worked as identified in the associated wage records. The QCEW contains data on the North American Industry Classification System (NAICS) code, which represents the industry in which the employer generates its greatest revenue. More importantly for this article, the QCEW contains data on the ownerships of the employers. These include the private sector and local, state, or federal government.
The data from the three administrative databases were combined to create a single record for each employee who worked for the executive branch of state government from first quarter 2000 to present. An algorithm to determine the primary employer for which the employee worked during the quarter was operationally defined as follows:
1. If the employee worked for the executive branch of state government, an employer was selected from state government agencies regardless of whether or not the individual made higher wages in the private sector, local, or federal government. If the employee worked for two state agencies in the quarter, the one paying the highest wages was selected as the primary employer.
2. All other persons not working for state government were assigned to the employer paying the highest wages during the quarter.
For example, an employee who began the quarter working for the Department of Workforce Services (earning $1,000), transitioned to the Department of Employment (earning $750), and finally wound up with an employer in the private sector (earning $3,000) in the same quarter would be assigned to the Department of Workforce Services. It is quite likely that in the next quarter the employee would only have one employer (the private sector employer).
Lastly, several concepts related to turnover are discussed in this analysis. The first is a continuous employee, which is defined as an employee who has the same primary employer in the current, previous, and subsequent quarter. A hire is an employee who did not work for the primary employer in the previous quarter and works for the employer in the current quarter. An exit is an employee who works for the employer in the current quarter and does not work for the employer in the subsequent quarter. For a complete overview of the turnover methodology used, please refer to Glover (2003).
Demographics and Market
Wyoming has an older population and work force than the national 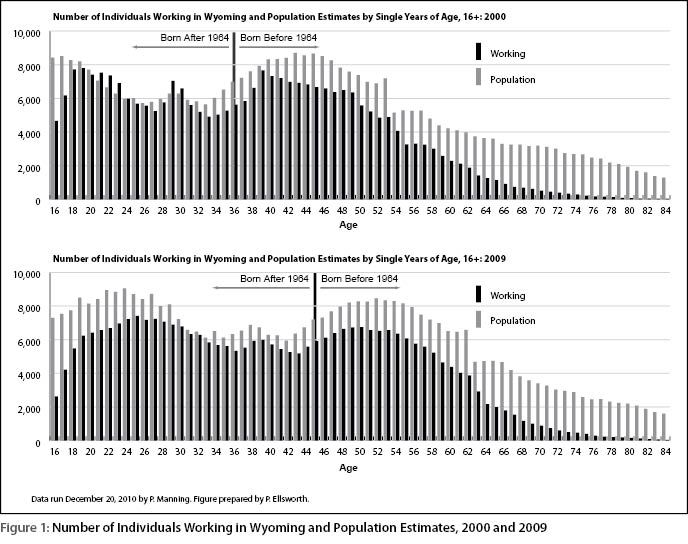 average with a high percentage of workers approaching the traditional retirement age of 65. Figure 1 shows population counts for Wyoming in 2000 and estimates in 2009, as well as the number of people working at any time during those two periods. The progression of the Baby Boom generation can be seen in this figure; as the number of people in Wyoming age 55 and older increased, so did the number of workers in that age group. In 2009, 31.3% of Wyoming's total population was age 55 or older (U.S. Census, 2010), while 19.4% of the state's total work force fell into the same age group (WYDOE, 2010).
Figure 1 also illustrates the impact that Wyoming felt from the economic downturn in 2009, especially among younger workers. In 2000, there were more people ages 21-24 and 29-30 found working in Wyoming than actually living in the state, indicating that large amounts of younger workers were imported from other states. This changed dramatically in 2009, as large numbers of residents under the age of 30 were not found working at any time in Wyoming.
Wyoming began importing a large number of out-of-state workers in 2005 as the unemployment rate fell to 3.5% and wage and salary growth stood at 3.3% (Jones, 2006). The number of out-of-state workers continued to increase during the state's economic expansion over the next few years. One way to determine the percentage of non-resident workers in Wyoming's labor force is to examine the number of UI claims filed by such workers (WYDOE, 2010). In 2000, non-resident workers made up less than 10% of all UI claimants; that percentage grew considerably over the next decade, and peaked in November 2009 at 24.8%.
The percentage of workers in state government age 55 and older is even 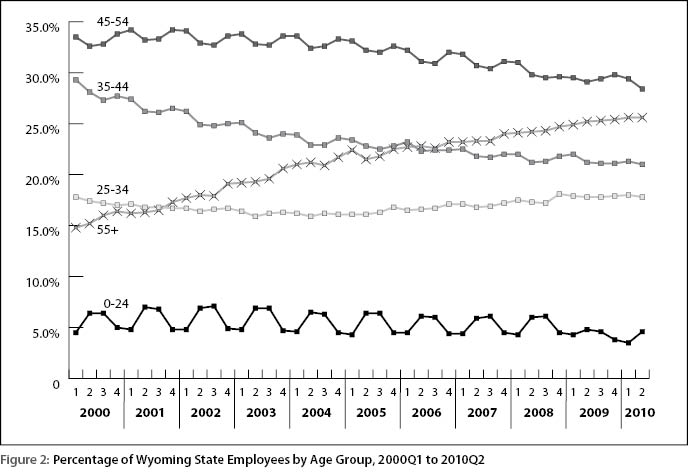 higher than the percentage in the overall work force. In first quarter 2000, workers in this age group made up 14.9% of all state employees; by second quarter 2010, these employees accounted for 25.6% of all state employees (see Figure 2). As these employees move into the traditional retirement age of 65 in the next 10 years, Wyoming state government could be faced with a high number of exits and few workers to replace them.
Recent studies have shown that as many as one in five retired workers age 50 and older continues to work in some capacity, and that 75% of retired workers in the same age group plan on working during retirement at some time in the future (Brown, et. al, 2010). Even so, older workers in Wyoming continue to leave state government. In late 2010, several senior level administrators within the Wyoming Department of Employment (WYDOE) retired from the department, including department director Gary Child. In a letter to WYDOE employees dated Dec. 16, 2010, Child wrote, "I have been privileged for 37 years to serve in varied capacities with the State of Wyoming and particularly this past 3½ years as the Department of Employment's Director." These recent exits from state government show that, even though many people may be working past the traditional retirement age of 65, the overall age of workers in state government is an indication that the state may want to consider preparing for a high number of exits.
As workers matured from one age group into the next during this period, older age groups began to make up a higher percentage of total state 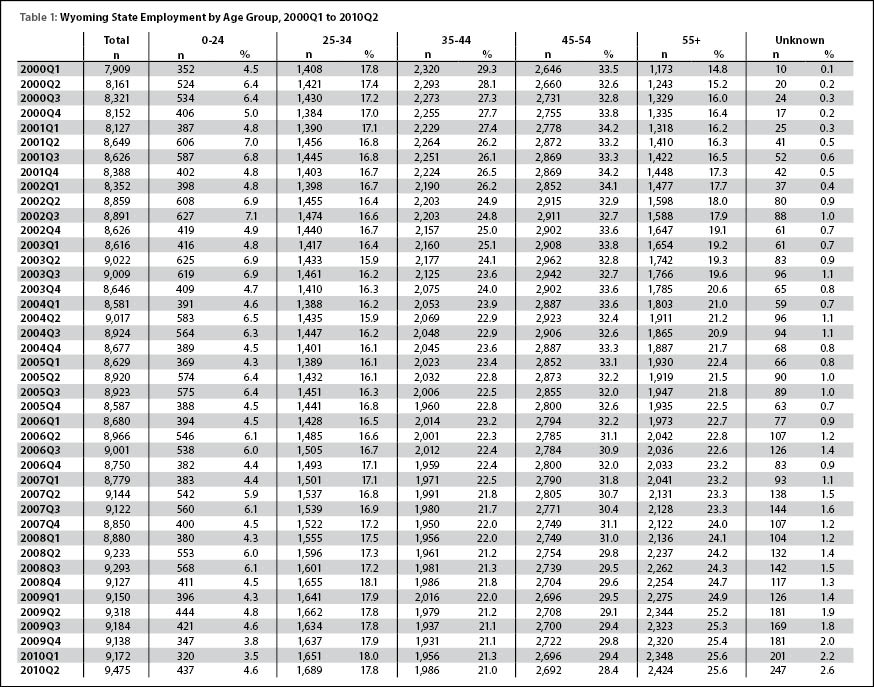 employment. From first quarter 2000 to second quarter 2010, the number of employees age 55 and older in state government more than doubled, increasing from 1,173 (14.8% of total employment) to 2,424 (25.6%; see Table 1). By comparison, state government employment among other age groups largely remained flat or declined during this period. The 35-44 age group saw the largest decline during this time, from 2,320 (29.3%) to 1,986 (21.0%). The overall number of workers ages 45-54 increased from 2,646 to 2,692, but this age group made up a smaller percentage of total employment in second quarter 2010 (28.4%) than it did in first quarter 2009 (33.5%). The number of workers in the 25-34 age group also increased during this period from 1,408 to 1,689, but this age group accounted for the same percentage (17.8%) of total employment in both periods.
Table 2 shows hires and exits within the executive branch of Wyoming 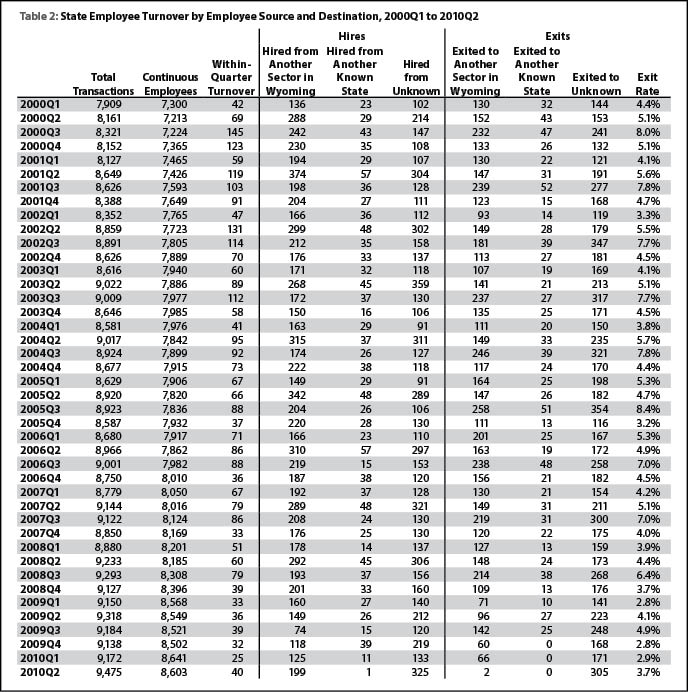 state government, divided into three categories each: those who were hired from or left for another sector of employment in Wyoming, such as local government or private industry; those found working in one of nine states for which R&P has access to data; or those who were not found in the market of Wyoming or surrounding states (administrative records) for the prior quarter for hires or subsequent quarter for exits. Within-quarter turnover consists of workers who were both hires and exits during the same quarter.
The first category consists of workers who were hired into state government from another sector in Wyoming, or left state employment to go to work in another sector in Wyoming. This includes such examples as a registered nurse leaving a private practice in the health care & social services industry to work for the Wyoming State Hospital, or a state employee leaving to work in the natural resources & mining industry during a period of economic expansion.
The second category of hires and exits is comprised of workers found working in one of nine states for which R&P has access to information. R&P acquires data from nine states that makes it possible to track workers who leave to find employment in one of those states. Included in this consortium are surrounding states of Colorado, Idaho, Montana, Nebraska, South Dakota, and Utah, as well as other states with high employment in the oil and gas industry, namely Alaska, New Mexico, and Texas.
The final category of hires and exits is comprised of workers who were not found in the WR database in a prior quarter for hires, or in a subsequent quarter for exits. Workers not found during a subsequent quarter include those who left a job in Wyoming state government and could not be found working in another sector or in one of the states for which data are available to R&P. This could be explained in a variety of ways, such as a person choosing to retire or work in another state for which data is not available to R&P, such as Louisiana or Michigan.
In addition to exits associated with demographic change, exits from state government fluctuate with Wyoming's economy. During times of economic prosperity, more state employees leave their jobs to work in another sector in Wyoming, especially private industry. In third quarter 2005, during Wyoming's most recent economic expansion, 258 state employees (2.9%) left to take a job in private industry in Wyoming. On the other hand, in third quarter 2009, when the state was well into an economic downturn, that number dropped to 142 (1.5%). During the first two quarters of 2010, only 126 employees left state government for another sector in Wyoming, the lowest at any period dating back to first quarter 2000. To some extent, state employees serve as a reservoir of human resources for the private sector accessible during times of rapid economic expansion.
Tables 3a and 3b show occupations in state government with especially 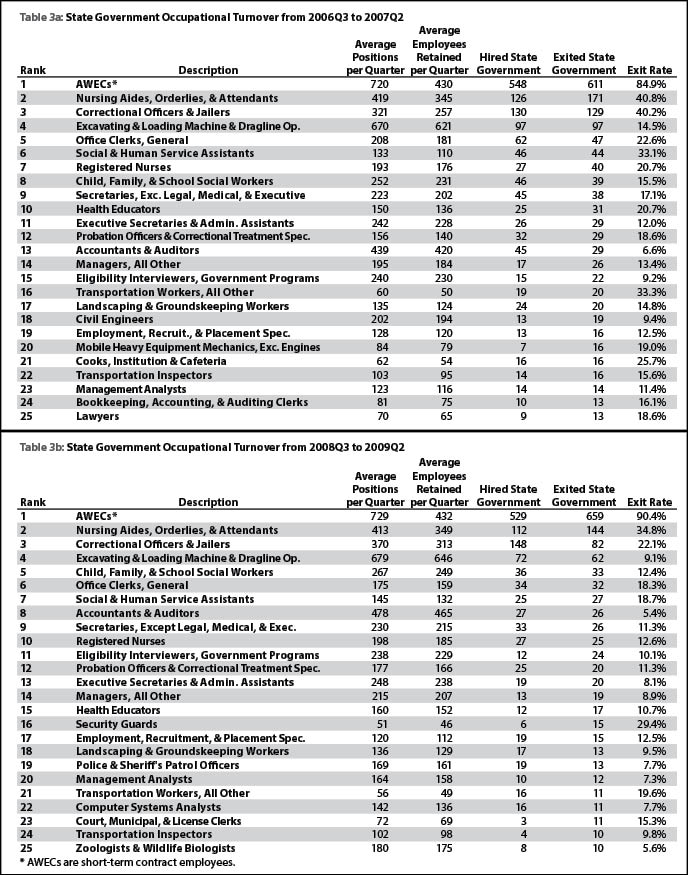 high exits for two different periods. The periods in these tables coincide with state fiscal years. Average positions per quarter are used as an analogous way to view the total number of positions for each occupation within state government. From third quarter 2006Q3 to second quarter 2007, there were an average of 419 nursing aides, orderlies, & attendants in state government per quarter, with an average of 345 retained per quarter. During this fiscal year, 171 left state government, which accounts for an exit rate of 40.8% over this four-quarter period. From third quarter 2008 to second quarter 2009, these numbers were similar: there were an average of 413 nurses, aides, orderlies & attendants per quarter, with 349 retained and 144 leaving state government (34.8%) over the fiscal year.
Succession Planning
Retaining employees can be a challenge for state government for a variety of reasons. Through succession planning, however, state government can identify many of the causes of turnover and take action to reduce replacement costs when feasible.
Succession planning is defined as a "process that not only seeks to identify areas within an organization that will not have enough workers as older employees retire, but also seeks to identify areas of workplace satisfaction that could be improved upon to increase worker retention" (Knapp, 2009). R&P has studied the importance of succession planning extensively, specifically in relation to Wyoming state government. In 2008, R&P observed that one-third of all state employees were age 55 or older, with another third between the ages of 45 and 54 (Knapp, 2008). This indicated that within 20 years, 60% of Wyoming state employees could retire, taking with them years of experience that would be difficult to replace.
In 2005, R&P surveyed 306 employees of the Department of Employment in order to study worker retention and identify factors associated with the decision to leave current employment (Gallagher, et. al, 2006). Research in this area has identified several factors in an employee's decision to leave state government, including availability of health insurance, household income, education, and the quality of the work environment and experience; this research also suggested that "the retention in the Department (of Employment) of workers in general is not exclusively a function of compensation." State agencies can take action to address factors associated with turnover separate from state compensation policy in order to reduce replacement cost.
An example of this can be seen among correctional officers in Wyoming. In 1999, 77 correctional officers left state government, among the highest number of exits of all occupations in state government. These employees then went on to earn 26% less in another sector in Wyoming after leaving state government (LSO, 2005). The authors of the publication interviewed some of these workers, and identified four main areas of dissatisfaction in their jobs as correctional officers: communication, management support, professionalism, and staffing.
Based on these findings, the authors made several recommendations, including "improving staff's perception of management through increased communication, providing consistent policies, and improving management support and recognition," as well as "increasing recruitment efforts, implementing more rigorous screening, and addressing wage and benefit issues." Current data suggest that several areas of concern that were identified may not have been addressed. From third quarter 2006 to second quarter 2007, 129 correctional officers (40.2%) left state government, and an additional 82 (22.1%) left from third quarter 2007 to second quarter 2008 (see Tables 3a and 3b).
Conclusion
With the first Baby Boomers reaching age 65, it seems important that Wyoming state government consider the cost of turnover and recruitment as state employees leave the work force. Although it is impossible to determine exactly when employees will leave state government, an understanding of historical trends and current demographics can help the state prepare for such events.
A future Trends article will examine state employees' departures by exploring where they went to work and what wages they earned after leaving state government.
Associate Editor Michael Moore can be reached at (307) 473-3814 or mmoore1@state.wy.us.
Workforce Information Supervisor William Glover can be reached at (307) 473-3826 or wglove@state.wy.us.
References
Brown, M., Aumann, K., Pitt-Catsouphes, M., Galinsky, E., and Bond, J. (2010). Working in Retirement: A 21st Century Phenomenon (p. 1). Retrieved January 5, 2011, from http://media.npr.org/assets/news/2010/10/05/workinginretirement.pdf
Gallagher, T., et al. (2006). Worker Retention and Factors Associated with Retirement. Retrieved December 21, 2010, from http://doe.state.wy.us/LMI/SP_Report.pdf
Glover, W. (2003). An Introduction to the Wage Records Applications. Released to states participating in the Wage Records Application Project, February 2003.
Knapp, L., Leonard, D., and Harris, M. (2008). 2008 Succession Planning Report: A Survey of Employees. Retrieved January 5, 2011, from http://wydoe.state.wy.us/LMI/SPR_08/contents.htm
Knapp, L. (2009). Comparing results of 2006, 2008 succession planning surveys. Wyoming Labor Force Trends 46(12). Retrieved December 21, 2010, from http://doe.state.wy.us/LMI/1209/a2.htm
U.S. Census. (2010). Retrieved December 30, 2010, from http://www.census.gov/popest/states/asrh
Wyoming Department of Employment, Research & Planning. (2010). Wage records database. Unpublished data.
Wyoming Department of Employment, Research & Planning. (2010). Unemployment Insurance database. Unpublished data.
Wyoming Legislative Service Office. (2000). Turnover and Retention in Four Occupations (pp. 41-51, A1-B1).