Comparing Results of 2006, 2008 Succession Planning Surveys
In 2006 and 2008, Research & Planning (R&P) conducted a succession planning survey within the Wyoming Department of Employment (DOE) and other state agencies. Succession planning is a process that not only seeks to identify areas within an organization that will not have enough workers as older employees retire, but also seeks to identify areas of workplace satisfaction that could be improved upon to increase worker retention.
One of the most important factors driving the need for succession planning
is an aging population. The oldest members of the baby boom generation
(born between 1946 and 1964) will reach the traditional retirement age
of 65 in 2011, and a large increase in retirements is expected to occur
over the next 20 years as the rest of this generation ages. As Figure
1 illustrates, the population of younger people in Wyoming is smaller 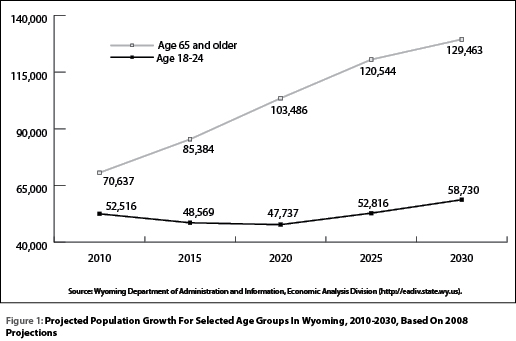 than
those age 65 and older and declining, while the number of those age 65
and older is growing. This is not just a problem for Wyoming or the nation,
but a global issue (United Nations, 2002). In Wyoming and the U.S., this
will affect business and government organizations in the future because
there will be a smaller labor supply to replace retired workers.
than
those age 65 and older and declining, while the number of those age 65
and older is growing. This is not just a problem for Wyoming or the nation,
but a global issue (United Nations, 2002). In Wyoming and the U.S., this
will affect business and government organizations in the future because
there will be a smaller labor supply to replace retired workers.
When the economy is in a downturn, as has been the case nationally since December 2007, succession planning tends to be viewed as less important by organizations than during an economic expansion. During hard economic times, employees, regardless of age, are less likely to voluntarily leave their jobs because of the uncertainty of finding new jobs. Older workers who might have been planning to retire when the economy was good may not retire during a recession because they cannot afford to do so. However, when the economy expands, the popularity of succession planning grows. The most important reason is to determine how the workplace will be affected as employees retire or leave for other reasons. Retirees, especially those with long histories at the same job, take with them large amounts of institutional knowledge that are difficult and costly to replace. Also important is the creation of a satisfactory work environment that will draw younger workers to fill spots vacated by retirees and retain them. This includes satisfaction with wages and benefits, positive interactions among employees and supervisors, a feeling of inclusion and involvement, and a sense of pride in the workplace.
R&P has conducted several studies related to succession planning. In both 2006 and 2008, succession planning studies were conducted within Wyoming state government, which involved many different occupations within one industry. In 2006 only the Wyoming Department of Employment (DOE) was surveyed, but the 2008 project included the Wyoming Department of Workforce Services (DWS) and the Wyoming Department of Family Services (DFS). For more information on the methodology and results of these studies, please see http://doe.state.wy.us/LMI/SP_Report.pdf and http://doe.state.wy.us/LMI/SPR_08/Succession_Planning_2008.pdf.
R&P has conducted similar research on nurses, an occupation critical to the state that spans a number of industries. The average age of nurses is increasing faster than that of workers in many other occupations and it is important to understand that process in order to retain nurses and recruit new nurses. In 2007 a survey was sent to nurses working in ambulatory care, hospitals, or long-term care in order to measure workplace satisfaction and to identify possible reasons why nurses leave their jobs. The methodology and results of this study can be found at http://doe.state.wy.us/LMI/nursing_retention_08.pdf. In 2008 the same survey was sent to nurses working in public health. The methodology and results of that study can be found at http://doe.state.wy.us/LMI/phn_09/title.htm.
The purpose of this paper is to examine the succession planning survey results from 2006 and 2008 for the Department of Employment. These results will be compared to identify areas of workplace satisfaction that changed significantly between the survey years.
Methodology
As noted earlier, in 2006 and 2008 R&P sent out a succession planning survey to DOE employees. The purpose of these studies was to measure employee satisfaction with aspects of their workplace and to identify the number of employees planning to leave employment with state government in the next five years because of retirement or some other reason.
Because R&P has access to data for two years, we were able to compare responses. This was accomplished in two ways. The two statistics used in this paper, the Wilcoxon Signed-Rank test and the Mann-Whitney U test, are statistics that measure the differences between two sets of data (in this case, the data collected in 2006 and the data collected in 2008). Both of these statistics produce a p-value, or probability, that tells us if there are statistically significant differences between the two sets of responses. Statistical significance is a term used to describe differences that are so significant that they cannot be due simply to chance. Any p-value that is less than or equal to 0.05 is considered statistically significant and is included in this discussion.
First, workplace satisfaction responses were analyzed using the Wilcoxon Signed-Rank statistic. This statistic is used to compare matched pairs of responses, so only those people who had worked in the department in both 2006 and 2008 and had filled out both surveys were included in the analysis. In total, this included 197 employees. Seven variables showed differences that were statistically significant and will be examined later in this report. Analyzing data this way causes a control situation. If the same employee’s responses change significantly during the time between surveys, it can be a way of showing whether any potential policy changes or other changes that may have been implemented during that period had any effect.
Each survey year also was treated as an independent sample so all of the survey responses in the analysis could be used, regardless of whether employees had worked for DOE in both years or filled out both surveys. Analyzing data in this manner is a way of pinpointing factors within the institution that may have changed. The response patterns of all employees should resemble the response patterns of only those who worked in the department in both years. If there are differences, it may be due to the culture of state government rather than to some definable problem within a department or agency.
In 2006 there were 255 respondents, 58 (22.3%) of whom either did not work for the department in 2008 or did not fill out a 2008 survey. In 2008 there were 245 respondents, 48 (19.6%) of whom had either not worked for the department or had not filled out a survey in 2006. In order to compare these two data sets as independent samples, R&P employed a statistical technique called the Mann-Whitney U test. When survey results were compared to each other in this manner, only three variables had statistically significant differences. These are discussed later in this report.
Matched Responses Analysis
When responses from each year were compared, seven variables
had statistically significant differences or were very close to statistical
significance. The first of these was the question, “My supervisor seems
to  care about me as a person” (see Figure 2, page 7; p=0.0551, which is
not statistically significant, but close). Although a majority of respondents
in 2006 (75.7%) and in 2008 (72.1%) agreed or strongly agreed with this
statement, a greater percentage of employees in 2008 disagreed or strongly
disagreed (15.8%) compared to 2006 (9.7%, p=0.0551).
care about me as a person” (see Figure 2, page 7; p=0.0551, which is
not statistically significant, but close). Although a majority of respondents
in 2006 (75.7%) and in 2008 (72.1%) agreed or strongly agreed with this
statement, a greater percentage of employees in 2008 disagreed or strongly
disagreed (15.8%) compared to 2006 (9.7%, p=0.0551).
The statement, “Someone other than my
supervisor seems to care about me as a person” also had responses that
had statistically significant differences between 2006 and 2008 (see Figure
3; p=0.0033). In both years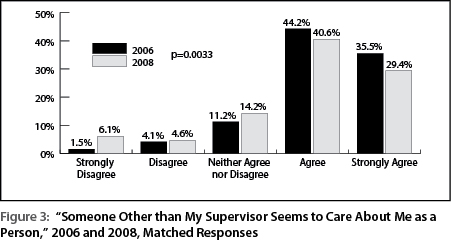 the majority of DOE employees agreed or strongly
agreed with the statement (79.7%, 2006; 70.0%, 2008). A greater proportion
of employees disagreed or strongly disagreed with the statement in 2008
(10.7%) than in 2006 (5.6%).
the majority of DOE employees agreed or strongly
agreed with the statement (79.7%, 2006; 70.0%, 2008). A greater proportion
of employees disagreed or strongly disagreed with the statement in 2008
(10.7%) than in 2006 (5.6%).
Respondents in both years were asked, “In
my department we can speak our minds without fear of reprisal” and there
were statistically significant differences in the responses for both years
(see Figure 4; p=0.0104). In 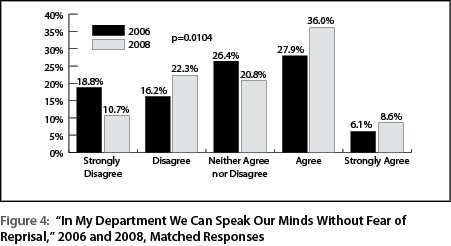 2006 only 34.0% of employees agreed or strongly
agreed that they could speak their minds without fear of reprisal compared
to 35.0% of employees who disagreed or strongly disagreed. In 2008, a greater
proportion of employees (44.6%) agreed or strongly agreed with this statement
although a similar proportion (35.0%) as in 2006 disagreed or strongly
disagreed. In 2006, 18.8% of employees strongly disagreed with the statement
and 16.2% disagreed, but in 2008 only 10.7% strongly disagreed compared
to 22.3% that simply disagreed. Not only were employees less likely to
say they disagreed to any degree with the statement in 2008, it appears
that those who did disagree did so to a lesser degree.
2006 only 34.0% of employees agreed or strongly
agreed that they could speak their minds without fear of reprisal compared
to 35.0% of employees who disagreed or strongly disagreed. In 2008, a greater
proportion of employees (44.6%) agreed or strongly agreed with this statement
although a similar proportion (35.0%) as in 2006 disagreed or strongly
disagreed. In 2006, 18.8% of employees strongly disagreed with the statement
and 16.2% disagreed, but in 2008 only 10.7% strongly disagreed compared
to 22.3% that simply disagreed. Not only were employees less likely to
say they disagreed to any degree with the statement in 2008, it appears
that those who did disagree did so to a lesser degree.
The statement, “I
speak highly of this department to others” had statistically significant
differences in responses for the two years (see Figure
5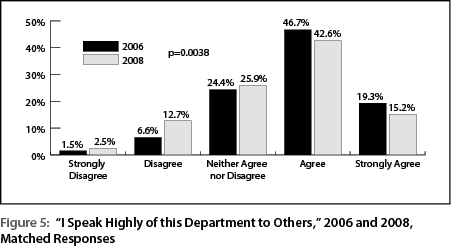 ; p=0.0038). In
2006, only 8.1% of employees disagreed or strongly disagreed with the statement
while 66.0% agreed or strongly agreed. In 2008 15.2% of employees disagreed
or strongly disagreed with the statement compared to 57.8% that agreed
or strongly agreed.
; p=0.0038). In
2006, only 8.1% of employees disagreed or strongly disagreed with the statement
while 66.0% agreed or strongly agreed. In 2008 15.2% of employees disagreed
or strongly disagreed with the statement compared to 57.8% that agreed
or strongly agreed.
Similarly, a greater proportion of employees agreed
or strongly agreed with the statement, “I am proud to tell people I work
for this department” (see Figure 6; p=0.0605; 61.9%, 2006; 57.3%, 2008)
but the number of 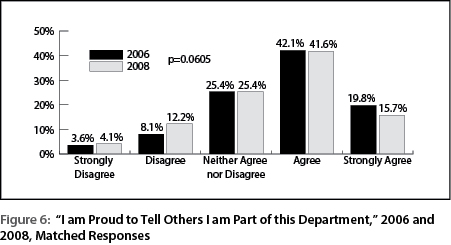 people who disagreed or strongly disagreed increased
between 2006 and 2008. In 2006 11.7% disagreed or strongly disagreed with
the statement and in 2008, 16.3% disagreed or strongly disagreed. Although
this variable was not statistically significant at the 0.05 level, it was
included because it was very close.
people who disagreed or strongly disagreed increased
between 2006 and 2008. In 2006 11.7% disagreed or strongly disagreed with
the statement and in 2008, 16.3% disagreed or strongly disagreed. Although
this variable was not statistically significant at the 0.05 level, it was
included because it was very close.
In both years employees were asked
to rate the statement, “I do not 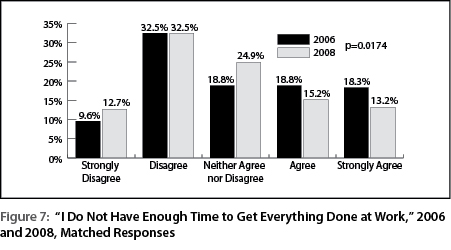 have enough time to get everything done
at work” (see Figure 7; p=0.0174). In 2006 more employees agreed or strongly
agreed (37.1%) than in 2008 (28.4%).
have enough time to get everything done
at work” (see Figure 7; p=0.0174). In 2006 more employees agreed or strongly
agreed (37.1%) than in 2008 (28.4%).
Finally, the last statement to have
statistically significant differences when responses were compared to each
other was a question regarding willingness to train coworkers in the employee’s
job duties (see Figure 8; 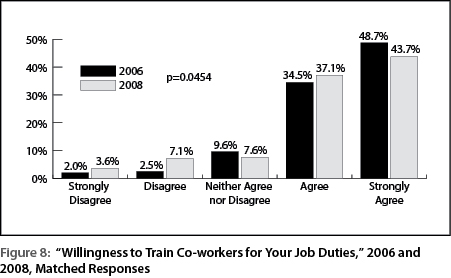 p=0.0454). In 2006 4.5% said this was unlikely
or very unlikely to happen while 83.2% said it was likely or very likely.
In comparison, in 2008, 10.7% said it was unlikely or very unlikely to
happen and 80.8% said they would be likely or very likely to train their
coworkers in their job duties.
p=0.0454). In 2006 4.5% said this was unlikely
or very unlikely to happen while 83.2% said it was likely or very likely.
In comparison, in 2008, 10.7% said it was unlikely or very unlikely to
happen and 80.8% said they would be likely or very likely to train their
coworkers in their job duties.
Unmatched Samples Analysis
When all of the responses in 2006 were compared to all of the responses
in 2008 as unmatched samples, only three variables had statistically significant
differences. The first was, “Someone other than my supervisor 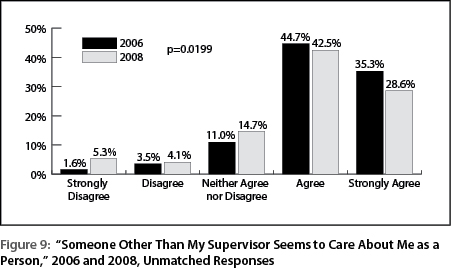 seems to
care about me as a person (see Figure 9; p=0.0199). A somewhat larger proportion
of employees disagreed or strongly disagreed with this statement in 2008
(9.4%) than in 2006 (5.1%). Overall, though, the majority of employees
agreed or strongly agreed with this statement in both 2006 (80.0%) and
2008 (71.1%).
seems to
care about me as a person (see Figure 9; p=0.0199). A somewhat larger proportion
of employees disagreed or strongly disagreed with this statement in 2008
(9.4%) than in 2006 (5.1%). Overall, though, the majority of employees
agreed or strongly agreed with this statement in both 2006 (80.0%) and
2008 (71.1%).
The statement, “I speak highly of this department to others”
also had statistically significant differences in responses for the two
years (see Figure 10, page 10; p=0.0201). In 2006 65.9% of employees agreed
or strongly 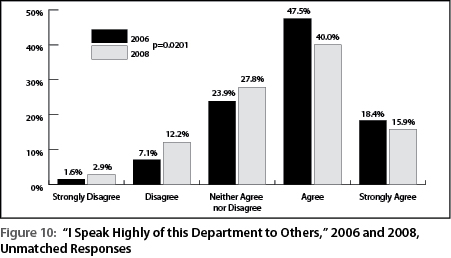 agreed with this statement and 8.7% disagreed or strongly disagreed.
In 2008 only 55.9% of employees agreed or strongly agreed with the statement
while 15.1% disagreed or strongly disagreed.
agreed with this statement and 8.7% disagreed or strongly disagreed.
In 2008 only 55.9% of employees agreed or strongly agreed with the statement
while 15.1% disagreed or strongly disagreed.
The last statement with statistically
significant results was, “I do not have  enough time to get everything done
at work (see Figure 11; p=0.0471). A smaller proportion of employees in
2008 (27.7%) agreed or strongly agreed than in 2006 (38.4%).
enough time to get everything done
at work (see Figure 11; p=0.0471). A smaller proportion of employees in
2008 (27.7%) agreed or strongly agreed than in 2006 (38.4%).
Comparison of Responses by Year and Age
In order to see if there was an underlying difference in responses to these questions by age group and by whether an employee had worked for DOE during the 2008 survey but not the 2006 survey, a chi square analysis was performed. As with the statistics used earlier in this paper, the chi square statistic is designed to identify any variable in which the responses are different for a group of people. There were no statistically significant differences in responses by age group or employment status for any of the variables discussed earlier.
Discussion
People’s opinions and views can change over time. They may be affected by age or experience, or there may be external factors that cause opinions to change, such as pay increases or increased workloads. Surveys that take place at a single point in time are limited in what kind of information they provide because they only show how the respondents felt at that moment. The survey can be used as a baseline measure to implement change, but without a follow-up survey there is no true way of determining what type of effects the changes may have caused. Ideally, this survey should be done approximately every three years to measure the effect of policy changes and other workplace changes on employees.
The Wyoming Department of Employment is not the only employer to use a succession planning type survey to make improvements to the workplace. According to a recent memo from the United States Office of Management and Budget (2009), the federal government plans to use a similar survey to “improve recruitment, retention, and results (p. 6).” The federal government also expects all agencies to create an action plan detailing ways to improve the workplace based on employee responses.
Because R&P has data from two points in time, we were able to determine if satisfaction levels had changed in the two years between surveys. Of the 29 questions asked on the succession planning survey regarding workplace satisfaction, only 7 had statistically significant differences when matched responses were analyzed, and only 3 had statistically significant results when all responses were compared. This indicates that, except in a couple of areas, overall workplace satisfaction did not change between the two years.
Four of the variables with statistically significant differences in the matched analysis group were related to employee interactions. In 2008 employees who had been with the department for both surveys were somewhat more likely to feel that their supervisors and other coworkers did not care about them than in 2006, and they were somewhat less likely to be willing to teach their job duties to other employees.
Also in 2008 employees who had completed both surveys seemed to be more comfortable with speaking their minds without fear of reprisal. After the 2006 survey was completed, DOE supervisors were given leadership training through their local community colleges. These courses included the essentials of leadership, coaching for success, resolving conflict, and working as a team. These courses, especially those related to handling conflict and leadership skills, were intended to help supervisors approach and work with their employees without the employees fearing for their jobs (C. Rando, personal communication, December 3, 2008).
The majority of employees in both groups said that, in 2008, they felt they had enough time to get all of their job duties done. In 2008 the state’s economy was expanding, which would have lightened the workload for many DOE employees. Most likely these results would be different if the survey were given now due to the declining economy and increasing number of unemployment insurance claims received by DOE and other duties.
References
United Nations. (2002). World population ageing: 1950-2050. Retrieved November 19, 2009, from http://tinyurl.com/yctdvfp
U.S. Office of Management and Budget. (2009, June 11). Memorandum for the heads of departments and agencies: Planning for the President’s fiscal year 2011 budget and performance plans. Retrieved December 8, 2009, from http://tinyurl.com/ycev5al