Training for What? Part 2
New Hires and Occupational Projections in Wyoming's Manufacturing Industry
Some of the most expensive and important decisions made by individuals and families are those dealing with education, training, and the search for gainful employment. Often, those decisions are influenced by occupational projections, which help shape policy, economic development, and individual career paths. However, occupational projections may not provide important answers about key points of occupational entry or changing skills requirements, nor reveal much about the operation of internal labor markets. This article examines employment in Wyoming's manufacturing industry, using different data sets to determine which occupations people are being hired for, the rate at which they are being retained, and how that compares to the latest occupational projections.Projections are calculated annually, while information on new hires is collected on a quarterly basis. Using these two products in tandem can be very valuable. While projections show which jobs are expected to grow, they are not intended to model the market; the new hires data are measurements of what is going on in Wyoming's labor force.
New Hires in the Manufacturing Industry
The occupational distribution used in this article is obtained from the state-federal Occupational Employment Statistics survey and presented in the Wyoming Wage Survey (Hauf, 2010). These data are collected twice per year and published annually; the most recent data were published with a reference date of May 2010. Detailed information about occupational distribution in Wyoming can be found online at http://doe.state.wy.us/LMI/EDSMarch2011/TOC000.htm.
The information on new hires in this article was obtained through the New Hires Survey conducted by the Research & Planning (R&P) Section of the Wyoming Department of Workforce Services (Knapp, 2011). A new hire is defined as someone who was hired by a firm for which he or she had not worked in at least the last 20 years (the time frame for which R&P has UI wage records). Information was collected on new hires from fourth quarter 2009 to third quarter 2010. Detailed articles and tables compiled using this information are available online at http://doe.state.wy.us/LMI/energy.htm.
Do People Get Jobs?
Even though Wyoming's overall employment level has declined or 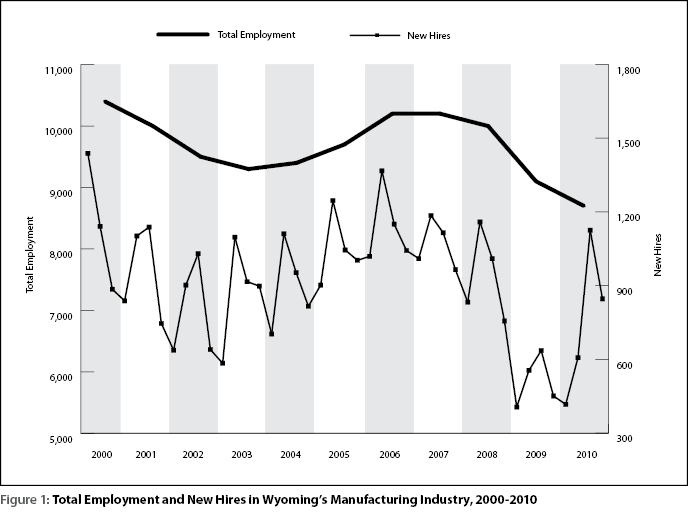 remained flat over the last few years, employers are constantly hiring new workers (Moore, 2011). This can be seen in the state's manufacturing industry, where total employment declined from 2007 to 2010, but hiring continued (see Figure 1). Compared to the 8,811 workers employed in manufacturing in May 2010, there were an estimated 2,568 hires from fourth quarter 2009 to third quarter 2010. This represents a quarterly average hire rate of 7.3%.
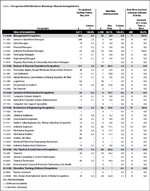
For the purpose of this article, a hire rate was calculated by dividing the number of new hires from fourth quarter 2009 to third quarter 2010 by the number of persons found in the occupational distribution. For example, in the occupational distribution, there were 147 bookkeeping, accounting, & auditing clerks employed in manufacturing (see Table 1). Of those, 23 were hired from fourth quarter 2009 to third quarter 2010. Dividing the number of new hires (23) by the number in the occupational distribution (147) results in a hire rate of 15.6%.
Hire rates for each industry in Wyoming are published with quarterly turnover statistics in Wyoming Labor Force Trends. Historical information for each quarter dating back to 1992 is available online at http://doe.state.wy.us/LMI/turnover.htm.
All occupations are placed into 23 major groups through the Standard Occupational Classification (SOC) system (U.S. Bureau of Labor Statistics, 2010a). Table 1 shows the occupational distribution and new hires for 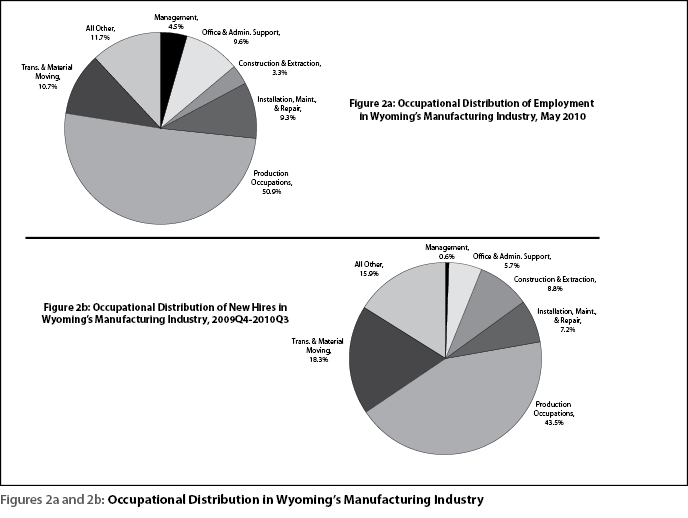 Wyoming's manufacturing industry by major occupational group and by detailed occupation for which information was available. Among all employees and new hires in the manufacturing industry, more were found in production occupations (SOC 51-0000) than in any other group of occupations (see Table 1 and Figures 2a and 2b). This group includes a variety of occupations such as welders, cutters, solderers, & brazers; machinists; cabinetmakers & bench carpenters; butchers & meat cutters; sewing machine operators; and bakers. In the occupational distribution, these types of jobs accounted for 50.9% of all employees; 43.5% of new hires in manufacturing were also found in production occupations.
Table 1 also shows the number of Wyoming new hires involved in energy-efficient activities. One of the purposes of the New Hires Survey was to determine what skills are needed to meet the demands of new and emerging technologies, specifically those involving energy efficiency. Energy-efficient jobs are those that produce goods or provide services that benefit the environment or conserve natural resources, or jobs in which workers' duties involve making their establishment's production processes more environmentally friendly or use fewer natural resources (U.S. Bureau of Labor Statistics, 2010b). More information on energy efficiency can be found at http://doe.state.wy.us/LMI/energy.htm and http://researchingthegreeneconomy.org/.
The New Hires Survey asked Wyoming employers to identify what "percent of the time a specific job involved activities and duties related to increasing energy, utilizing or developing renewable energy resources, or preserving and/or restoring the environment" (Wyoming Department of Employment, 2010). In Wyoming's manufacturing industry, 489 (19.0%) of the 2,568 new hires were involved in energy-efficient activities. Of those, 38.0% spent half of their time or more in energy-efficient activities.
Do People Keep Jobs?
The types of jobs found in the occupational distribution and in new hires are considerably different (see Figures 2a and 2b). Management occupations (SOC 11-0000) made up 4.5% of the occupational distribution, but accounted for just 0.6% of new hires in manufacturing. This was also true for office & administrative support (SOC 43-0000; 9.6% of the occupational distribution and 5.7% of new hires) and installation, maintenance, & repair (SOC 49-0000; 9.3% of the occupational distribution and 7.2% of new hires) occupations. In contrast, transportation & material moving occupations (SOC 53-0000) accounted for 18.3% new hires and only 10.7% of the occupational distribution.
This may be interpreted to mean that occupations with a low hire rate have a higher rate of tenure. Table 2 shows what percentage of new hires in 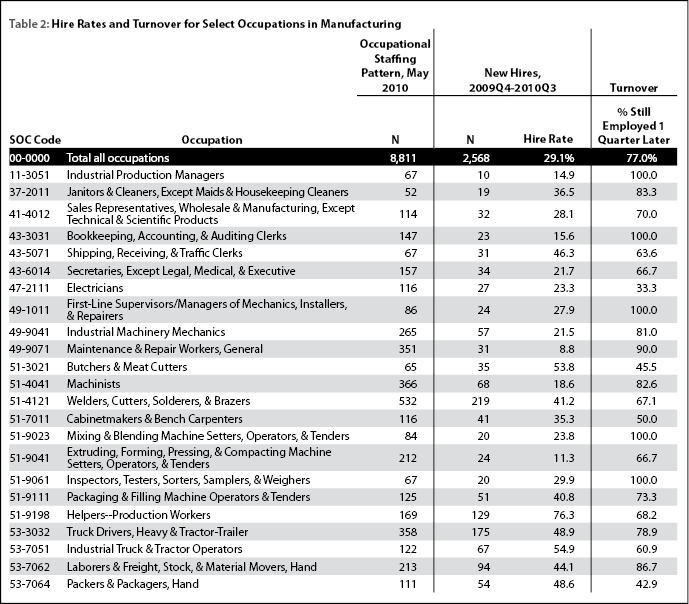 selected occupations in manufacturing were still employed one quarter after hire. For example, the hire rate of industrial production managers (SOC 11-3051) was 14.9%, and 100.0% of those hired from fourth quarter 2009 to third quarter 2010 were still employed one quarter later. This was also true for bookkeeping, accounting, & auditing clerks (SOC 43-3031; 15.6% hire rate, 100.0% still employed one quarter after hire), maintenance & repair workers, general (SOC 49-9071; 8.8% hire rate, 90.0% still employed one quarter after hire), and machinists (51-4041; 18.6% hire rate, 82.6% still employed one quarter after hire). In contrast, occupations with a high rate of hire may have a higher rate of turnover. Industrial truck & tractor operators (SOC 53-7051) had a hire rate of 54.9%, and only 60.9% of those were still employed one quarter after hire. This was also true for butchers & meat cutters (SOC 51-3021; 53.8% hire rate, 45.5% still employed one quarter after hire).
The high rates of turnover for these types of occupations may be influenced by a variety of factors, such as age and experience. This is an area that can be studied further as new hires data are collected for additional quarters.
Comparing Occupational Projections
and New Hires
Occupational projections are used by employers, educators, policymakers, jobseekers, and others. Students and jobseekers use these projections to help choose a career path, while educators and employers use them to help educate and train the workforce. Occupational projections assume that demand increases proportionally across the occupational distribution. However, there are several factors not taken into consideration with occupational projections.
Projections do not take into consideration job vacancies that are created by the permanent exits of current employees from Wyoming's labor force. A permanent exit is defined as a person who was employed in Wyoming's labor market for the four quarters prior to the reference date, but is not employed in the subsequent three quarters. These exits are attributed to factors such as relocation, withdrawal from the market to care for a family member, retirements, or death. When a permanent exit occurs, this creates a need to replace that worker. Over the next 10 years, the most significant source of employment opportunities in the state will come from the need to replace current workers (Glover, 2011).
The difference in projected net growth and annual openings — which 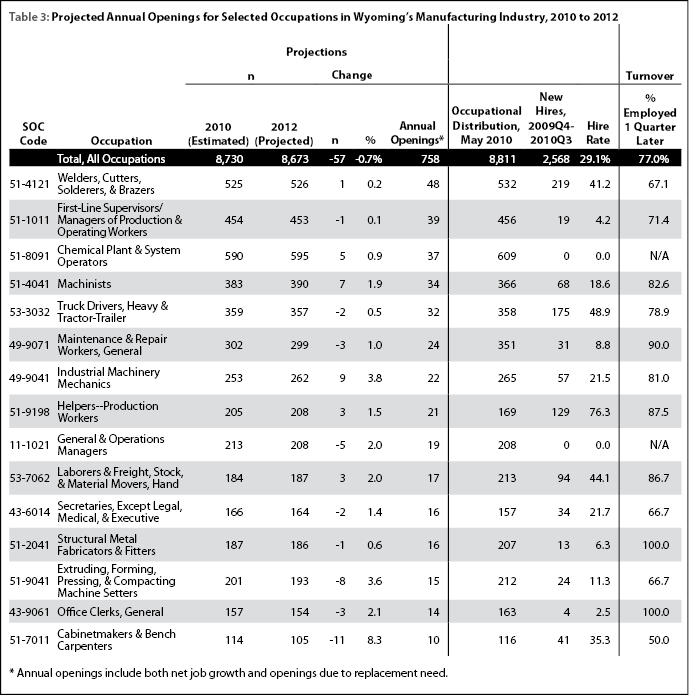 include both net growth and replacement need — for select occupations in manufacturing can be seen in Table 3. The latest short-term occupational projections by industry show that the manufacturing industry is projected to lose a net 57 jobs from 2010 to 2012 (essentially no net change), with 758 annual openings. While there is essentially no net change in manufacturing from 2010 to 2020, the 758 annual openings take into consideration openings due to permanent exits from Wyoming's labor force.
Occupational projections also do not differentiate between internal hires — those hired from within the company — and external hires, so the rate at which workers are hired is an important factor to consider when selecting a career path or training potential workers. Some occupations that are projected to grow over the next two-year period may have a low hire rate, suggesting that those occupations may grow through internal hiring.
Of the 15 occupations with the highest number of projected annual openings, 6 had hire rates below 10.0% from fourth quarter 2009 to third quarter 2010: first-line supervisors/managers of production & operating workers (4.2%); chemical plant & systems operators (0.0%); maintenance & repair workers, general (8.8%); general & operations managers (0.0%); structural metal fabricators & fitters (6.3%); and office clerks, general (2.5%). This may suggest that manufacturing employers fill these types of jobs internally, and will need to provide training internally or arrange for outside training.
Projections also underestimate the impact of turnover. Although some occupations may have a large number of projected annual openings, they may also have high rates of turnover. For example, the occupation of cabinetmakers & bench carpenters is projected to grow by a net 10 jobs with 10 annual openings from 2010 to 2012 (see Table 3). However, of the 41 cabinetmakers & bench carpenters hired from fourth quarter 2009 to third quarter 2010, only 50.0% were still employed one quarter after hire. The occupation of extruding, forming, pressing, & compacting machine setters is projected to grow by 7 jobs with 15 annual openings from 2010 to 2020; however, of the 24 new hires in this occupation, only 66.7% were still employed one quarter after hire. Educators and employers may want to take turnover rates into account when making decisions about training.
A table showing turnover for new hires across all industries in Wyoming from fourth quarter 2009 to third quarter 2010 can be found online at http://doe.state.wy.us/LMI/energy/New_Hires_Turnover_4Q.htm.
When used together, hire rate and turnover provide information that can be beneficial to those looking for jobs and the employers and educators that offer training. For example, 175 truck drivers, heavy & tractor-trailer, were hired in manufacturing from fourth quarter 2009 to third quarter 2010, with a hire rate of 48.9% (see Table 2). Of those new hires, 78.9% were still employed one quarter later. This occupation had both a high rate of hire and a relatively low amount of turnover. By comparison, packers & packagers, hand, had a similar hire rate (48.6%), but only 42.9% of those new hires were employed one quarter after hire. Educators and employers may want to consider whether it is in their best interests to train potential employees for an occupation with a high rate of turnover. Jobseekers may want to evaluate whether they should enter a job with a high rate of turnover.
Conclusion
While occupational projections are a valuable tool for jobseekers, employers, educators, policymakers, and others, there are several key factors that are not considered by projections alone. The information highlighted in this article can be combined with these projections to help educators and employers make informed decisions about training needs, and can also be very valuable to students and jobseekers as they choose a career path.
References
Glover, T. (2011). Departure of workers creates significant job openings. Wyoming Labor Force Trends 48(5). Retrieved July 19, 2011, from http://doe.state.wy.us/LMI/0511/a4.htm
Hauf, D. (2010). Wyoming Wage Survey 2010. Retrieved July 14, 2011, from http://doe.state.wy.us/LMI/oes2010/oes10.pdf
Knapp, L. (2011). Survey captures data on Wyoming new hires. Wyoming Labor Force Trends 48(2). Retrieved July 14, 2011, from http://doe.state.wy.us/LMI/0211/a2.htm
Moore, M. (2011). Wyoming new hires: examining the wage gap. Wyoming Labor Force Trends 48(3). Retrieved July 13, 2011, from http://doe.state.wy.us/LMI/0311/a1.htm
U.S. Bureau of Labor Statistics. (2010a). 2010 SOC User Guide. Retrieved July 19, 2011, from http://www.bls.gov/soc/soc_2010_user_guide.pdf
U.S. Bureau of Labor Statistics. (2010b). Measuring Green Jobs. Retrieved July 20, 2011, from http://www.bls.gov/green/
Wyoming Department of Employment, Research & Planning. (2010). New Hires Survey. Retrieved July 20, 2011, from http://doe.state.wy.us/LMI/energy/new_hires_survey.pdf