© Copyright 2011 by the Wyoming Department of Workforce Services, Research & Planning
Wyoming Labor Force Trends — June 2011
Vol. 48 No. 6
June 2011
- PDF Version
- Table of Contents
- Credits
- Training for What? Part 1: Manufacturing Sector in Wyoming Small but Growing
- Training for What? Part 2: New Hires and Occupational Projections in Wyoming's Manufacturing Industry
- ARRA Dynamics in the Labor Market
- Mean Center of Population for the United States: 1790 to 2010
- Occupation Spotlight: Preschool Teachers, Except Special Education
- Wyoming Unemployment Rate Falls to 6.0% in April 2011
- State Unemployment Rates – Seasonally Adjusted
- Seasonally Adjusted Unemployment Rate Graph
- State Unemployment Rates – Not Seasonally Adjusted
- Wyoming Nonagricultural Wage and Salary Employment
- Campbell County
- Sweetwater County
- Teton County
- Nonagricultural Wage and Salary Employment Graph
- Nonagricultural Employment Growth Graph
- Economic Indicators
- Wyoming County Unemployment Rates
- Wyoming Normalized Unemployment Insurance Statistics: Initial Claims
- Statewide
- Laramie County
- Natrona County
- Statewide by Industry Graph
- Statewide by County Graph
- Wyoming Normalized Unemployment Insurance Statistics: Continued Claims
- Statewide
- Laramie County
- Natrona County
- Statewide by Industry Graph
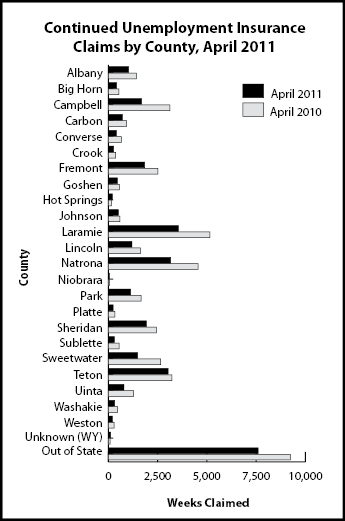
- Statewide by County Graph
- Map of Wyoming Regions, Counties, and County Seats with County Unemployment Rates

