Results of the Baseline Survey
The United States is currently undergoing an unprecedented shift in economic activity. Many factors are contributing to this shift, including reducing the nation's dependence on foreign energy supplies, transitioning from nonrenewable to renewable energy sources, reducing greenhouse gas emissions, limiting pollution, and increasing energy efficiency.Changes in national economic activity and national energy policy can have potentially large impacts on Wyoming's labor market. Currently, the U.S. derives approximately 45% of its energy supply from coal-fired power plants (U.S. EIA, 2009) and approximately 40% of that coal is mined in Wyoming. For example, the Powder River Basin is the largest coal-producing region in the country (U.S. EIA, 2011). Any policy that affects the production and use of coal nationally will have a substantial direct impact on Wyoming's labor market and tax revenues, with many indirect impacts as well. Additionally, the increased interest in utilizing renewable energy technologies will also significantly impact Wyoming. The southern Wyoming corridor in particular is a favorable location for wind power development (U.S. EIA, 2011). A change in the demand for coal and the construction and operation of wind farms are just two examples of how Wyoming's economy can be effected by changes in national energy policies, as well as changes in national and global economic conditions.
The Research & Planning section of the Wyoming Department of Employment has undertaken several projects to determine the effect of these economic changes on Wyoming's labor market. This particular project involved surveying Wyoming firms regarding their production activities and processes to determine how (or if) Wyoming's economic activities are changing and if so, how these changes affect the demand for the relevant occupations in the state. This is an initial study to establish a baseline for further research efforts as these changes continue to impact Wyoming's economy.
The impetus for this study was identified in the Northern Plains and Rocky Mountain Consortium's technical proposal (Northern Plains and Rocky Mountain Consortium, 2010):
"The Green Jobs Act of 2007 mandates that state labor market research, information, and labor exchange research programs identify job openings in the renewable energy and energy efficiency sector";
"Special research is needed to determine how green energies such as biofuels, wind power and carbon sequestration are to be measured from both an industrial (e.g. for the 2012 NAICS revision) and occupational perspective."
In 2010, R&P joined a consortium of Northern Plains and Rocky Mountain states in order to fulfill these requirements. The consortium is comprised of the following states: Montana (project lead), Iowa, Nebraska, South Dakota, Utah, and Wyoming.
Definitions
The abbreviation "EE" (energy efficiency or energy-efficient jobs) is used to represent the jobs discussed in this article. This term includes more than jobs that enhance energy efficiency. EE jobs include employment in the production, implementation, or regulation of:
- Renewable energy and alternative fuels. Manufacturing, construction, design, research, delivery, operation, storage or maintenance of wind, solar, biomass, hydro, alternative transportation fuels, geothermal, methane, and waste incineration as a fuel source.
- Energy efficiency and conservation. Manufacturing, construction, or installation of energy-efficient products, energy efficiency services, weatherization, building retrofitting/efficiency, energy-efficient production processes, energy distribution improvements, and transportation technology.
- Pollution, waste, and greenhouse gas management; prevention, and reduction. Activities related to controlling emissions and pollution. Includes controlling and reducing greenhouse gas emissions, waste water, and other pollutants.
- Environmental cleanup and restoration and wastewater cleanup and mitigation. Environmental restoration including the cleanup and disposal of pollution, waste, and hazardous materials; Superfund/Brownfield redevelopment; and landfill restoration.
- Education, regulation, compliance, public awareness, training, and energy trading. Activities that educate on energy efficiency, renewable energy, energy rating systems certifications, and more efficient energy consumption. Enforcement of compliance requirements and regulations, and training on effective use of energy-related products and processes.
- Sustainable agriculture and natural resource conservation. Products and services to conserve, maintain, and improve natural resources and environment, including low carbon and organic agriculture, land management, water management and conservation, wetlands restoration and environmental conservation.
The preceding six categories of EE employment are considered as EE output employment; these employees produce or in some way enhance an EE product.
There is another method by which employment could be considered EE employment; this method is called EE process employment. This occurs when the firm does not produce an EE product, but the employees provide skills that result in a more EE outcome to the production process. For example, a large construction contractor listed no EE products. This firm employed an environmental engineer and a safety and occupational health manager that both provided EE benefits during the firm's production activities. These two jobs would be considered as EE process jobs.
The survey results show total employment of 3,734. Depending on the method of EE job estimation used, the total employment for EE jobs was 122 or 141. The resulting percentage of EE jobs was 3.3% and 3.8%, respectively.
Methodology
Sample Selection
A sample was chosen that proportionally reflects the Wyoming industry mix. A total of 1,034 business units were surveyed. The first mailing occurred on June 21, 2010 with questionnaires (and associated cover letters and brochures) being mailed to all business units chosen for sampling. The subsequent two mailings were sent only to those business units for which no response had been received or the questionnaire had been undeliverable. The second mailing occurred on July 15 and the third on August 12. Data collection ended on September 17.
Of the 1,034 questionnaires mailed, 453 were completed (at least partially), two were refused, and 51 were undeliverable, with a response rate of 43.8%. Of these 453, 46 were excluded from further analysis due to the employer being out of business or sold, or because the firm did not provide an answer to the question, "How many employees does your organization have at this location?" There were 407 observations left after excluding the aforementioned questionnaires. This number allows for a statewide (not industry-specific) analysis with a 95% level of confidence and a 4.8% margin of error.
Calculation of Total EE Employment
Eighteen employers listed detailed job descriptions on the inside of the survey after they stated that there were no EE jobs or left Question 2 blank. There are two likely possibilities for this discrepancy:
- The employer thought he or she was supposed to list all jobs, not just EE jobs, or;
- He or she did not answer Question 2, but actually did have EE jobs listed under the detailed section.
Therefore, the detailed section was examined to see if the employer marked any of the three categories listed under "Percent of time involving environmental benefits or energy efficiency improvement for workers who had this job." If so, it was assumed that this was an EE job, at least partially, and was therefore counted in the EE job total.
Calculation of Wages
Wage information was obtained by asking respondents to indicate how many employees fell into the 12 wage categories provided. These categories were borrowed from the Occupational Employment Statistics (OES) survey instrument (Hauf, 2010). For more information on OES, see http://wydoe.state.wy.us/LMI/oes2010/oes10.pdf. The midpoint of each category was used to calculate the average wage in categories 2 through 11. There is no midpoint for categories 1 and 12, therefore the boundary wage was used (e.g. $9.25 and $90.00, respectively).
Results 
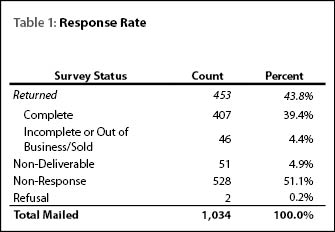
Table 1 shows a gross response rate of43.8%. After adjusting for non-deliverable questionnaires, the net response rate was 46.3%. After removing incomplete questionnaires or responses from firms that were out of business or had been sold, there were 407 observations remaining for analysis. 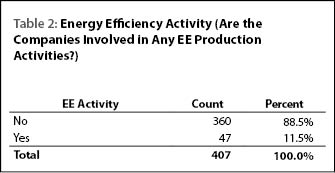
Table 2 indicates that 11.5% of the employers surveyed had EE production activities.
There were 3,734 total employees included in the analysis (see Table 3). Of  these, depending on the method of EE job estimation used, 122 (3.3%) or 141 (3.8%) people had at least a portion of their work time devoted to EE activities. While both calculations have strengths and weaknesses, the remainder of this article will use the 141 figure, as this has been deemed the most representative of the respondents' intentions. This 3.8% roughly corresponds with the findings of California (3.4%; State of California, 2010), Oregon (3.0%; Oregon Employment Department, 2009), and Washington (3.3%; Hardcastle, 2009).
EE Process vs. Output Jobs
Of the 141 total EE jobs, 33 could be considered EE process jobs, which is 0.01% of total employment and 23.4% of all EE employment. There is a possibility that some of these jobs would have been allocated to EE output employment, but the respondent left Question 2 blank or felt that the firm's product did not fit into any of the six categories shown.
Industries Involved in EE Activities/Employment
Table 4 displays the percentages of EE activity and employment by major 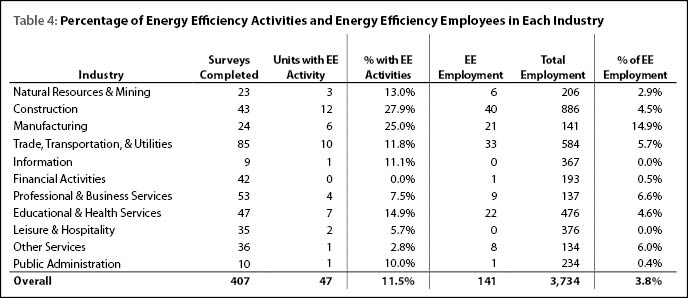 industry classification. Approximately 28% of the construction firms indicated that they participated in EE activities, followed closely by manufacturing firms at 25.0%. In terms of employment, the manufacturing sector (14.9%) and the professional & business services sector (6.6%) indicated the highest levels of EE employment.
Occupations Involved in EE Activities
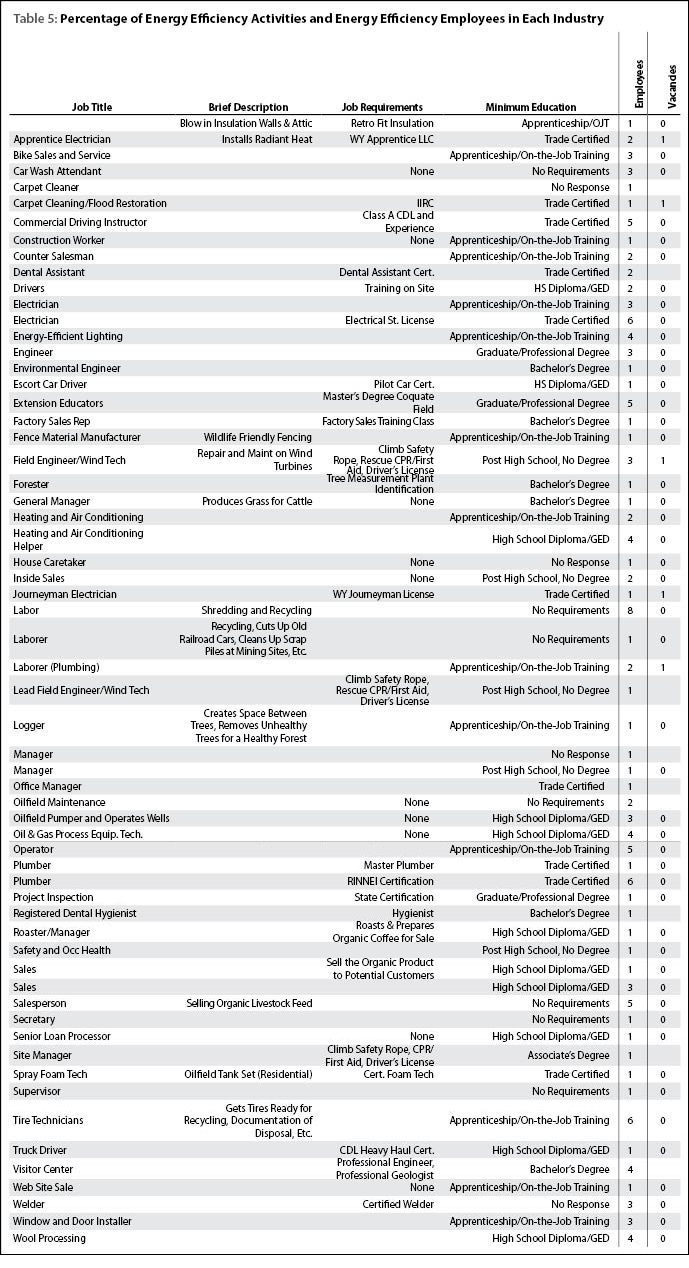 Table 5 details the information that was gathered regarding job titles, job requirements, and the minimum educational level required. Due to the relatively small sample size of detailed occupational information, no strong conclusions can be reached from this information. The occupation occurring most frequently was electrician. There were 12 electricians listed as having some portion of their time spent on EE activities. This increases to 16 if the four individuals with the job title 'Energy Efficient Lighting' are included. Respondents also indicated that there were 7 plumbing and 6 HVAC (Heating, Ventilating, and Air Conditioning) EE jobs. Table 6 indicates the average wage for an electrician from this study, a related study called the New Hires Survey, and the OES (Occupational Employment Statistics) survey.
This sample indicates that in Wyoming, EE jobs largely exist within 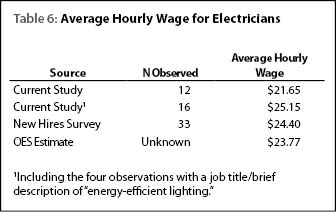 established occupations rather than in new occupations. The wind energy sector may be the exception. There were three jobs with a job title of "field engineer/wind tech" which would likely be coded in the Standard Occupational Classification (SOC) as "wind energy technicians" or "wind turbine service technicians," both of which have an SOC code of 49-9081. This is a new code in the 2010 SOC edition. There was no code for this in the previous edition of the SOC, which was published in 2000.
Increased Demand in the Near Future?
One objective of this survey was to determine (if possible) whether there would be an increase in the need for EE jobs in the near future. Unfortunately, the question regarding how many vacancies there were for a particular occupation was left largely blank. From the detail grid on pages 2 and 3 of the survey instrument, 11 respondents listed at least one vacancy for a given occupation. Only five of these vacancies were for an EE job. A companion survey titled the New Hires Survey, which is an ongoing survey that focuses on newly hired employees, may shed more light on the issues of increased demand for new or emerging occupations.
Analysis of Non-Response
Is there anything systematically 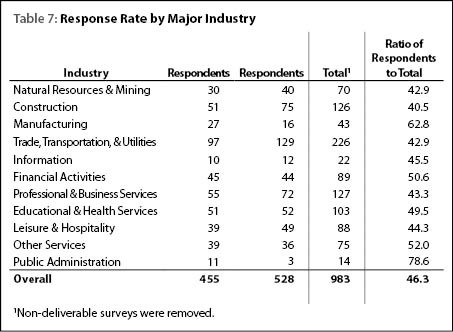 different between respondents and non-respondents? Tables 7 and 8 indicate the number of respondents, the number of non-respondents, and the ratio of number of respondents to the total number of questionnaires mailed (excluding non-deliverable questionnaires). Table 7 is organized by major industry classification, while Table 8 is organized by the size class of the firm based on total employment. Table 7 shows that the response rates for the manufacturing and public administration sectors had
 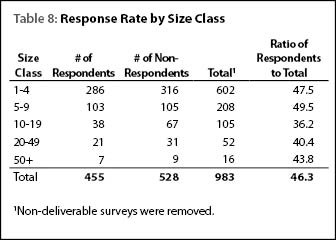 higher responserates than the other sectors. In Table 8, the two smaller size classes had the best response rates.
No strong inference has been drawn from these results. However, there are many factors that could affect response rates. Responding to this survey was not mandatory. Therefore, the response rate will be affected by a potential respondents' willingness to complete the questionnaire. This is in turn affected by their feelings regarding the worth of the survey's objectives, and whether they have enough time to complete the questionnaire. Another important factor is whether or not the questionnaire was seen by a person in the firm who would have enough knowledge of the firm's operations (e.g. a human resource specialist or a manager) to respond to the survey effectively. This may be one reason that the firms in the lower two size classes responded at a higher rate than larger firms. For example, a potential respondent at a firm with eight employees is more likely to be informed about all the firm's activities than a potential respondent at a firm with 500 employees.
Further Research
There are other issues regarding EE employment that could be the focus of future research. For example, how much job creation is temporary (i.e. during construction) versus long-term (i.e. ongoing operation and maintenance)? The creation of a wind turbine farm is a good example of this issue. How much is true job creation vs. job replacement? The longitudinal nature of the UI database will prove useful in assessing this issue.
References
Bleizeffer, D. (2010, November 16). Wyoming pursues carbon sequestration near Rock Springs. WyoFile. Retrieved March 9, 2011, from http://wyofile.com/2010/11/wyoming-pursues-carbon-sequestration-rock-springs/
Hardcastle, A. (2009). 2009 Washington State Green Economy Jobs. Retrieved March 9, 2011, from http://www.workforceexplorer.com/admin/
uploadedPublications/10258_Green_Jobs_Report_for_Web_2009.pdf
Hauf, D. (2010, March). Wyoming Wage Survey March 2010. Retrieved March 9, 2011, from http://wydoe.state.wy.us/LMI/oes2010/oes10.pdf
Northern Plains and Rocky Mountain Consortium. (2010). Researching the Green Economy (Technical Proposal).
Oregon Employment Department. (2009, June). The Greening of Oregon's Workforce: Jobs, Wages, and Training. Retrieved March 9, 2011, from http://www.qualityinfo.org/pubs/green/greening.pdf
State of California, Employment Development Department, Labor Market Information Division. (2010, October). California's Green Economy: Summary of Survey Results. Retrieved March 9, 2011, from http://www.energy.ca.gov/cleanenergyjobs/GrSurveyRpt_1115.pdf
U.S. Energy Information Administration. (2009). Retrieved March 9, 2011, from http://www.eia.gov/state/state_energy_profiles.cfm?sid=WY
U.S. Energy Information Administration. (2011). Annual Energy Review. Retrieved March 9, 2011, from http://www.eia.gov/aer/pdf/pages/sec1.pdf
Washington State Employment Security Department. (2009, July). 2008 Washington State Green Economy Jobs Addendum. Retrieved March 9, 2011, from http://www.workforceexplorer.com/admin/
uploadedPublications/9832_Green_Jobs_Report_Addendum_2009.pdf