Survey Captures Data on Wyoming New Hires
During the spring of 2010, the Research & Planning (R&P) section of the Wyoming Department of Employment, along with several other state Labor Market Information offices, received funding to study the workforce and, as a subset, jobs that spend time on activities that increase energy efficiency, use or develop renewable energy resources, or preserve and restore the environment. R&P designed a mail questionnaire that contained a question intended to measure the degree to which a job was involved in any of these energy-efficient activities and was designed to capture and assess the types of skills needed for jobs in Wyoming. Ultimately, the goal of this project is to determine what types of jobs are available in the state, which ones are likely to be energy-efficient, and whether there are any significant differences between energy-efficient jobs and those that are not energy efficient.The results of this study will inform educators, training providers, and policy-makers about the skill sets employers think are important for these jobs. These entities can then use the results to develop curricula to help train Wyoming's future workforce for these positions.
This study employs a strategy of combining survey data with administrative datasets such as the Wyoming Unemployment Insurance (UI) Wage Records database and the Quarterly Census of Employment and Wages (QCEW). Among the advantages to using the UI Wage Records database linked to other administrative datasets is that it is a low-cost source of data and, because it is collected by law for tax purposes, there is less chance for the recall bias or misrepresentation that can occur with surveys.
As Figure 1 shows, there are many advantages to using linked 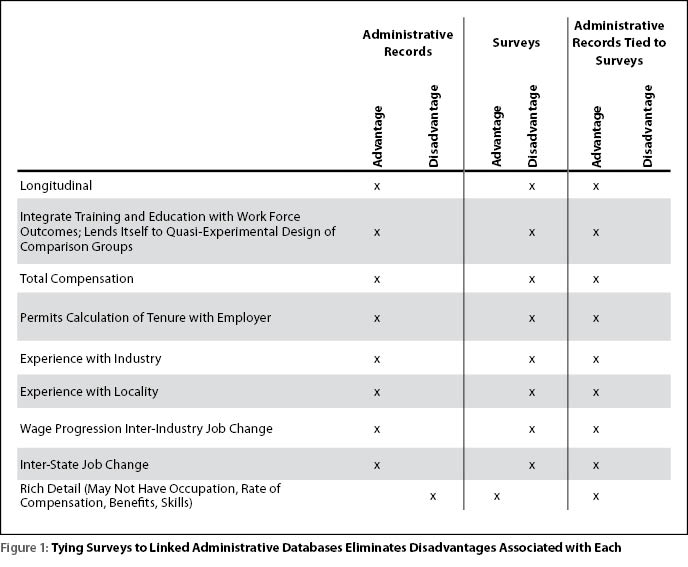 administrative data. In the past, they have been used to analyze wage progression, job tenure and turnover, compensation, training outcomes, commuting, and more. Because these datasets are collected at regular intervals, it makes using longitudinal analysis to identify trends and changes over time possible. Administrative databases also allow for a quasi-experimental research design to conduct comparisons between groups with a certain characteristic (treatment group) and a random, matched sample of the total population (control group) to identify statistically significant differences between the two.
Although there are many advantages to using administrative datasets in research, there is one major disadvantage. Administrative datasets lack the rich detail needed for some research, which is where survey data become important. Survey data are used by R&P to supplement administrative datasets with information on occupations, skills, educational requirements, indirect compensation, satisfaction, etc. The biggest disadvantage to using survey data is that it is costly. The second is that it represents a cross-section of a population taken at a single point in time and cannot be used to identify trends or change. However, R&P is able to link survey responses to administrative datasets to track respondent outcomes over time or for other longitudinal research.
This strategy, combining administrative data with survey data, has been used by R&P several times in the past. In 2003 (Saulcy, 2003) and 2004 (Saulcy, 2004), a questionnaire was sent to employers regarding the skills of recent Wyoming community college graduates. The responses from these questionnaires were combined with UI wage records data to track community college students after graduation, compare the wages of community college graduates to non-college graduates, and to analyze the satisfaction of employers with the skills of the people they hire. In 2005, R&P worked with the Wyoming Lodging and Restaurant Association (Saulcy and Harris, 2005) to compare the employment and wage history of students who had participated in the Wyoming Hospitality Alliance Mentoring (WHAM) program to those who did not. Survey data were collected during this project to analyze employer satisfaction with the skills of those who had gone through the program.
Among the topics in the current survey questionnaire is the extent to which jobs in the state are engaged in energy-efficient activities. The Bureau of Labor Statistics (BLS) defines energy-efficient jobs in two ways. The first is an output approach and is defined as "jobs that produce goods or provide services that benefit the environment or conserve natural resources." The second is a process approach and is defined as "jobs in which workers' duties involve making their establishments' production processes more environmentally friendly or use fewer natural resources" (Bureau of Labor Statistics). For the purposes of this study, energy-efficient jobs may fit into either or both of the definitions since the categories are not mutually exclusive.
Currently there is little research available about what jobs are most likely to perform energy-efficient activities but the results of this study should help to provide more insight. This research will also provide information about the industries in which these energy-efficient jobs are found. Staffing patterns then can be used to determine whether any differences exist in the way employers fill energy-efficient jobs and jobs that are not energy-efficient. Analysis also will compare tenure and wage progression for employees working in energy-efficient jobs compared to others.
The data from this project will allow for the comparison of the types of skills needed for jobs that perform energy-efficient activities and those that do not. It will also allow for the comparison of other job-related attributes such as education, benefits, and wages.
There is no current comprehensive and accurate source of data describing the jobs for which Wyoming employers hire. The data collected during this study will show what types of job openings are available in the state and the skills and qualifications workers need for those jobs. Benefits and pay rates are also being collected and will be analyzed by job and industry.
Finally, the results of this study will be combined with wage and employer data from the UI Wage Records database to determine job tenure — how long the employee stayed with the firm — and wage progression. Tenure and wage progression are both important tools in assessing job quality. R&P has conducted research on this subject in the past (Edlin, 1995), particularly in terms of evaluating training programs (Harris, 2002). With the results of this study, tenure can be measured for jobs that perform energy-efficient activities and for those that do not, and can be compared to determine any significant differences.
Methodology
Table 1 contains an example of quarterly turnover statistics, which are 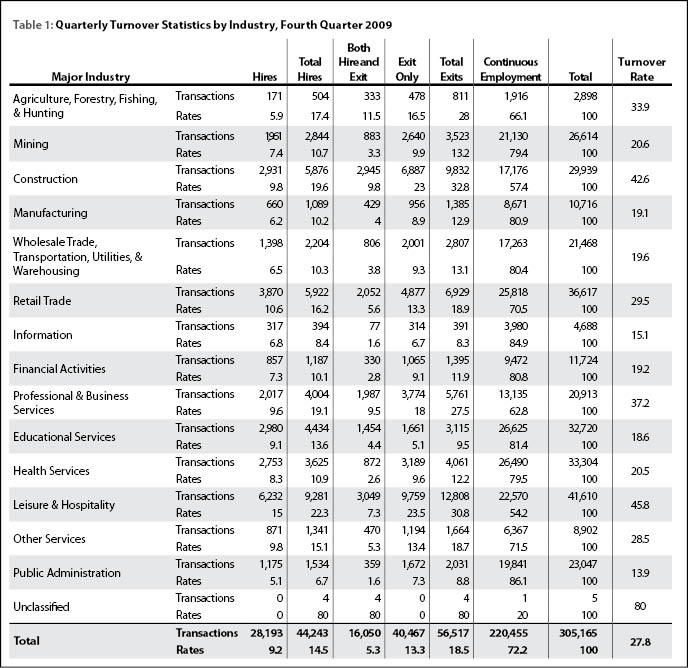 included in R&P's Wyoming Labor Force Trends publication (Leonard, 2010). UI wage records are used to create turnover statistics. These wage records contain the employer's unemployment insurance identification number, worker social security number, and worker wages by quarter for each job worked in Wyoming. It is possible for a worker to have more than one job in a quarter, so turnover statistics refer to the transaction or job rather than the worker. There are four types of transactions related to turnover:
Hires, in which a person is hired for a job in a specified quarter and is still employed by that employer in the next quarter;
Exits, in which the employee has worked for a firm during a specified quarter and those prior, but not during the subsequent quarter;
Both hire and exit, in which the employee started a job and worked for a firm only within a quarter;
Continuous, where the employee is employed by a firm for all quarters of interest (previous, current, and subsequent; Glover, 2001).
During fourth quarter 2009 (2009Q4; the reference period for the first panel of this study), there were 28,193 jobs in the state that were a "hire" (9.2% of all transactions), 16,050 jobs that were both a "hire" and an "exit" (5.3% of all transactions), 40,467 jobs categorized as exits (13.3% of all transactions), and 220,455 jobs that were worked continuously (72.2% of all transactions). The total turnover rate during this quarter was 27.8%.
For the purpose of this study, R&P was interested in sampling from only those employees who were designated "hires," excluding those who fell in the "both" category. Specifically, this research only included employees who were considered a "new hire" during the quarter of interest (2009Q4, in this case). "New hire" was defined as someone who was hired by a firm for which he or she had not worked in at least the last 20 years (the time frame for which R&P has UI wage records). Rehires were excluded to control for the confounding effects of seasonal re-hiring and to eliminate circumstances where employers and employees based hiring decisions on prior joint human capital and business investment. Finally, R&P was most interested in including new hires who were retained by the same employer for at least two quarters. These jobs were probably more likely to require a training or educational investment by the employer. This was done to track the types of jobs for which employers were hiring and the skills required for these positions.
Because R&P wanted to use the most current UI wage records available for drawing the sample, it meant that there would not be access to data from the subsequent quarter to verify that the employee still worked for the same employer. To estimate the probability of employment duration lasting more than one quarter, a binary logistic regression model was created to predict which new hires would still be working in the next quarter. This model was created by using historical new hire data from first quarter 2005 through first quarter 2009. Five variables (age, wages, gender, industry, and quarter) were added as independent variables in the attempt to explain retention (Leonard, 2010).
All new hires in the most current quarter of UI wage records data were given a score based on the results of the logistic regression. It was decided that a probability of 0.5 was the lowest acceptable value for the probability of retention. Only those with a score of 0.5 or greater were selected from the universe; this became the subset of workers from which the survey sample was drawn. This methodology was tested using two available quarters of UI wage records data prior to beginning the project and the model was found to have an accuracy rate of more than 70%. The results of this study will be generalized to the universe of all new hires meeting the model criteria.
R&P randomly samples employers for several other research projects. To reduce survey burden and increase response rates, any employer receiving one of the other mail questionnaires was removed. In addition, in order to reduce the respondent burden, it was decided that the maximum number of questionnaires any employer would get was four. This decision was made based on prior experience regarding respondent burden and the need for an adequate sample of events. Up to four new hires were randomly selected from each employer UI account; those selected jobs then became the final universe from which the sample was drawn.
There were 28,193 total hires-only during 2009Q4 (the most current 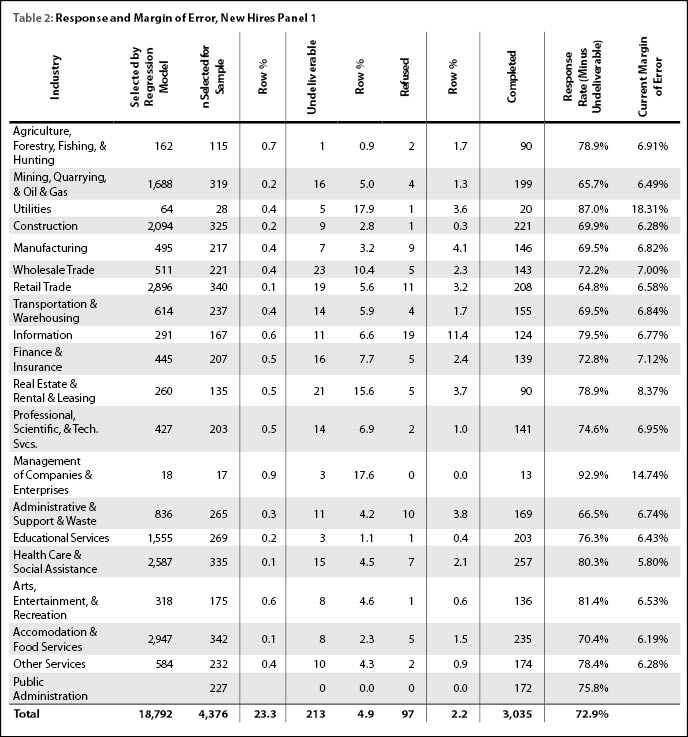 quarter of data available when the project started; see Table 1), but 9,401 were removed for several reasons. Many of these were removed because they were rehires or they did not meet the 0.5 threshold for probability of working with the same employer during the next quarter (2010Q1), or they were outside of the up to four randomly selected employees from each firm. This left 18,792 new hires (see Table 2) from which to draw the 2009Q4 sample.
The sample was stratified by industry. As illustrated in Table 1, industries in Wyoming vary widely in their turnover, hiring practices, skill sets, etc. Essentially, the sample was drawn independently for each industry in a manner that would ensure a 95% confidence level with +/- 0.05 error. Table 2 shows the number of new hires that, according to the regression model results, would most likely be employed by the same employer for at least two quarters and the number included in the sample by industry.
Employers with employees in the sample were sent a cover letter and a questionnaire for each sampled employee along with an addressed, stamped return envelope. The cover letter included information about the purpose of the questionnaire and information on how the study results would be used.
This project was designed to measure elements of the job rather than attributes and abilities of the employee hired for the job. Questions on the mail questionnaire pertained to the rate of pay, hours worked, benefits offered, and qualifications needed for the job as well as the amount of time that job performed energy-efficient tasks. The questionnaire also included a series of job skills and asked employers to rate the level of importance of each skill to the job on a scale of one to three. These skills included service orientation, critical thinking, reading comprehension, technology design, and operation and control. Employers were given a space to write in the one skill they felt was most important in performing the job's duties. That skill may have been one that was included in those that the employer had previously rated, or it might have been something completely different. Finally, there were two questions about the employee: the employer's level of satisfaction with the employee's work skills and whether the employee was still employed in the job. These two were the only questions on the survey instrument that referred directly to the worker.
R&P hired the Wyoming Survey and Analysis Center (WYSAC) at the University of Wyoming to perform cognitive interviews with the questionnaire and cover letter (Furgeson & Dorsomm, 2010). The purpose of these interviews was to ensure the questionnaire and cover letter were easy to read and understand, and, in the case of the questionnaire, that it was actually measuring the concepts it was intended to measure. WYSAC randomly chose 10 companies to participate in these interviews; these companies fell into a variety of geographical regions, industries, and employer sizes to better represent the economic make-up of the state.
The results of these cognitive interviews were used to refine the content of the cover letter to better convey to employers the purpose of the study and what they were being asked to do. The results were also used to simplify or clarify questions on the survey instrument that interviewees found confusing and to revise those questions that did not appear to capture the desired data. More information about this process and the cognitive interview findings can be found at http://doe.state.wy.us/LMI/energy/wysac_report_SRC1014.pdf.
Data collection for the first panel of this project, which consisted of new 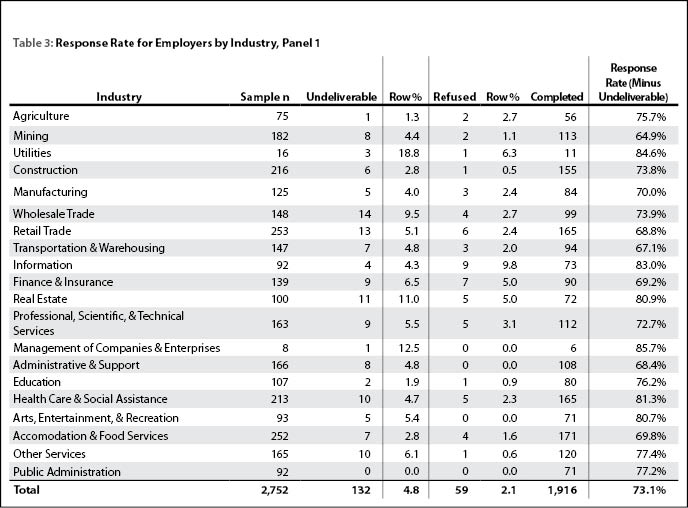 hires from 2009Q4, began on May 26, 2010, and ran through June 11, 2010. Address refinement postcards were mailed to the 2,752 employers for whom the new hires worked (see Table 3). These cards included a space for the employer to supply contact information such as name and title, as well as space for address updates. They were then mailed back to R&P. Updated address information also was received from the United States Postal Service for postcards that could not be delivered to the address on file.
Questionnaires were sent out in June 2010, and data were collected through September 2010. A questionnaire was mailed to employers up to three times during this period. During the first mailing (June 14 – July 2, 2010), all employers received questionnaires pertaining to their new hires. Only employers who did not respond received questionnaires during the two follow-up mailings (July 8 – July 30, 2010, and August 2 – September 22, 2010, respectively). On August 18, 2010, in order to increase the response rate, R&P began making phone calls to employers who had not responded to any of the three questionnaires that had been mailed to them, and their responses were taken over the phone.
Table 2 shows detailed response data for the first panel of this study. In total, questionnaires were mailed out for 4,376 new hires, approximately 23.3% of the new hires eligible to be sampled. Of these, 213 (4.9%) could not be delivered due to insufficient employer address information, and 97 employers (2.2%) refused to respond. R&P received 3,035 completed questionnaires. After removing the questionnaires that could not be delivered from the total, the overall response rate was 72.9%. The response rate by industry ranged from a high of 92.9% for management of companies & enterprises to a low of 64.8% for retail trade. The 97 refusals were included in the calculation of response rates but will not be included in any further analysis.
Employers were asked to mark "yes, the employee did work for this 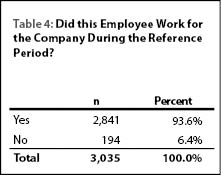 company during the reference period" or "no, the employee did not work for this company." As shown in Table 4, 2,841 (93.6%) of questionnaires were marked "yes" and 194 (6.4%) were marked "no." If they chose yes, they were asked to complete the questionnaire; if they chose no, they were asked to mail the questionnaire back to R&P in the enclosed envelope. All returned questionnaires, regardless of how the employer answered this question, were included in the calculation of response rates. However, only responses from the questionnaires that indicated the employee did work for the firm were used in the following analysis.
Analysis
As noted in the introduction, energy-efficient jobs are defined as such based on the goods they produce, the methods of production, or both. One of the research questions this project seeks to answer is whether there is a difference in job tenure for those employed in energy-efficient jobs compared to those employed in jobs that employers do not consider energy-efficient. To do this, the proportion of employees still employed by the same firm one quarter after hire (the most current data available) are compared for each group. Because currently only one panel of data has been collected, only broad generalizations are possible at this time. As R&P collects more data, advanced statistical analysis will be performed.
Overall, R&P received data on 2,841 new hires during the first panel of data collection (see Table 4) for which the employer responded, "yes, the ![]() employee did work for this company," and, of those, 2,782 had valid responses to the question regarding the job's level of energy-efficiency (see Table 5). In total, 446 (16.0%) worked in energy-efficient jobs while 1,838 (66.1%) worked in jobs that were not considered energy-efficient. The energy-efficient status was unknown for almost one in five workers (n = 498, 17.9%). A greater proportion of those working in energy-efficient jobs (n = 356, 79.8%) were still employed one quarter after hire compared to those not working in energy-efficient jobs (n = 1,375, 74.8%) or those where the energy-efficient status was not known (n = 375, 75.3%).
employee did work for this company," and, of those, 2,782 had valid responses to the question regarding the job's level of energy-efficiency (see Table 5). In total, 446 (16.0%) worked in energy-efficient jobs while 1,838 (66.1%) worked in jobs that were not considered energy-efficient. The energy-efficient status was unknown for almost one in five workers (n = 498, 17.9%). A greater proportion of those working in energy-efficient jobs (n = 356, 79.8%) were still employed one quarter after hire compared to those not working in energy-efficient jobs (n = 1,375, 74.8%) or those where the energy-efficient status was not known (n = 375, 75.3%).
Data for two industries, mining (NAICS 21) and healthcare & social assistance (NAICS 62, examples include hospitals, nursing homes, child and youth services, and daycare facilities), are also shown in Table 5. Completed questionnaires were received for 184 new hires in the mining industry and 235 new hires in the health care & social assistance industry. In mining, 46 employees (25.0%) had energy-efficient jobs and of those, 76.1% (n = 35) were still employed one quarter after hire. In comparison, far fewer employees in health care & social assistance had energy-efficient jobs (n = 15, 6.4%), but a larger proportion of those that did have energy-efficient jobs were still employed after one quarter (n = 14, 93.3%).
Table 6 shows selected statistics by occupation for jobs in the mining  industry. Of these jobs, 25.0% (n = 46) were considered energy-efficient while 79 (42.9%) were not considered energy-efficient and the energy-efficiency status was unknown for approximately one-third (n = 59, 32.1%). According to the data available, a greater proportion of employees holding energy-efficient jobs were still employed one quarter after hire (76.1%) than those not holding energy-efficient jobs (68.4%). The proportion of employees still employed one quarter after hire where energy-efficient status was unknown fell in between the other two categories (72.9%).
Table 7 contains similar data for employees working in health care and 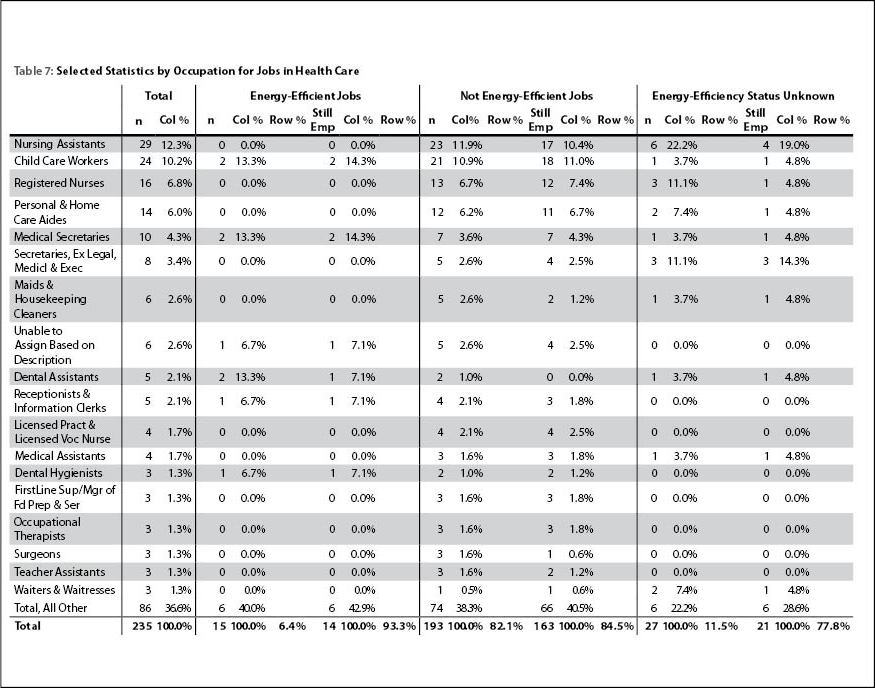 social assistance. Of the 235 new hires for whom data was provided, 15 (6.4%) held energy-efficient jobs, 193 (82.1%) held jobs that were not considered energy-efficient, and there were 27 (11.5%) that could not be categorized. A greater proportion of workers in energy-efficient jobs were still employed a quarter after hire (93.3%, n = 14) than those in jobs that were not energy-efficient (84.5%, n = 163). Employees in jobs that could not be categorized as energy-efficient or not had the smallest proportion of employees still working one quarter after hire (77.8%, n = 21).
Conclusion
Although the data collection process for this project is not complete and there is not enough information to make solid conclusions, the evidence thus far supports the concept that new hires holding energy-efficient jobs are more likely to stay employed at that job longer than those in jobs that are not energy-efficient. Currently R&P has collected data for one panel in one quarter. Ultimately, at least four quarters of data will be collected, which should result in enough data to conduct more in-depth statistical analyses. Future analyses will study tenure differences in greater detail as well as look into the possible reasons why employees with energy-efficient jobs have longer tenure, should that continue to be true. Analyses will also be done to compare the types of jobs that are considered energy-efficient and those that are not, and to compare the types of skills workers need to work in energy-efficient jobs compared to the skills needed for jobs that are not energy efficient.
Research Analyst Lisa Knapp can be reached at (307) 473-3835 or lknapp@state.wy.us.
Statistical Data Technicians Katelyn Rhoades and Laura Stryker collected and managed the data gathered through the New Hires Survey.
References
Edlin, G. C. (1995). Steady work pays off: Wyoming unemployment insurance wage records revisited. Wyoming Labor Force Trends, 32(10). Retrieved December 2, 2010, from http://doe.state.wy.us/LMI/1095/1095a1.htm
Furgeson, T. & Dorsomm, M. (2010, April). Cognitive interviews for the Wyoming Department of Employment: Testing a job skills questionnaire.
WYSAC technical report no. SRC-1014. Retrieved December 15, 2010, from http://doe.state.wy.us/LMI/energy/wysac_report_SRC1014.pdf
Glover, T. (2001). Turnover analyses: Definitions, process, and quantification. Retrieved November 26, 2010 from http://doe.state.wy.us/LMI/w_r_research/
Turnover_Methodology.pdf
Harris, M.A. (2002). Measuring the impact of Wyoming's workforce development training fund. Wyoming Labor Force Trends, 39(5). Retrieved December 2, 2010, from http://doe.state.wy.us/LMI/0502/a1.htm
Harris, M.A. (2002, June). Measuring the impact of Wyoming's workforce development training fund: Part two. Wyoming Labor Force Trends, 39(6). Retrieved December 2, 2010, from http://doe.state.wy.us/LMI/0602/toc.htm
Leonard, D. (2010). Logistic regression modeling and worker retention. Retrieved March 9, 2011, from http://wydoe.state.wy.us/LMI/energy/reg_method.pdf
Leonard, D. (2010). Quarterly turnover statistics by industry, fourth quarter 2009. Wyoming Labor Force Trends, 47(7). Retrieved November 26, 2010, from http://doe.state.wy.us/LMI/0710/a6.htm
Saulcy, S. (2003). Connecting business and the Wyoming community college: A study of employment outcomes of 2001 graduates from Wyoming community colleges. Retrieved November 26, 2010, from http://doe.state.wy.us/LMI/CollegeReport2003.pdf
Saulcy, S. (2004). Introduction. In Where are They Now? Community College Graduates' Labor Market Outcomes 2004 (pp. 15-16). Retrieved November 26, 2010 from http://doe.state.wy.us/LMI/CollegeReport2004.pdf
Saulcy, S. and Harris, M.A. (2005). Cooking up a career: Examining the outcomes of a high school training program in the culinary arts and hospitality management. Retrieved November 29, 2010, from http://doe.state.wy.us/LMI/WHAMReport.pdf
U.S. Bureau of Labor Statistics. Measuring Green Jobs. Retrieved December 1, 2010, from: http://www.bls.gov/green/