Can High School Students Use Labor Market Information to Make Informed Career Choices?
 |
High school students from Star Lane Center in the Natrona County School District were shown how to access occupational projections, wages, and other data provided by the Research & Planning section of the Wyoming Department of Workforce Services. The students were tasked with analyzing their chosen career paths and presenting their findings to the Wyoming Workforce Development Council.
The project required students to use occupational projections and wage information to analyze their chosen career paths in terms of the education required for the career and the potential for earnings once employed. Students were also asked to assess some of the vocational training opportunities proposed by NCSD’s forthcoming Center for Advanced and Professional Studies (CAPS) program. Students were given access to occupational wages, projections, and other R&P data in order to complete the project. Occupational wages and projections information used by the students can be found on R&P’s website at http://doe.state.wy.us/LMI/projections.htm.
Also inside December Trends:
Long-Term Occupational Projections by Educational Level and Replacement Need: 2012 to 2022
According to the latest projections from the Research & Planning section of the Wyoming Department of Workforce Services, Wyoming is expected to add 54,006 new jobs from 2012 to 2022, but the best outlook for employment will be the need to replace workers who leave the state’s workforce over the 10-year period (Glover, 2013).
Continue Reading →
2013 Publications from Research & Planning
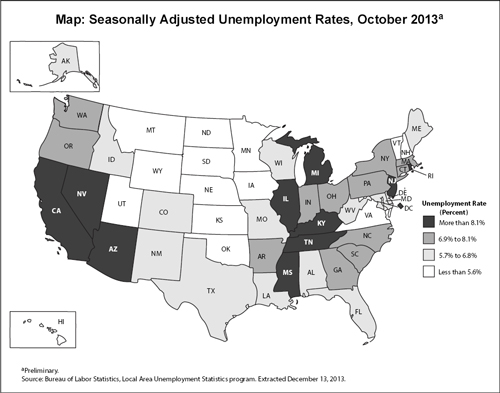
Map: Seasonally Adjusted Unemployment Rates, October 2013
Wyoming Unemployment Rate Fell to 4.5% in September Then Rose to 4.6% in October 2013
The Research & Planning section of the Wyoming Department of Workforce Services has reported that the state’s seasonally adjusted unemployment rate fell to 4.5% in September and then rose to 4.6% in October (neither change was statistically significant). Wyoming’s unemployment rate decreased from its year-ago level of 5.1% and remained significantly lower than the current U.S. unemployment rate of 7.3%.
Continue Reading →
Table of Contents
- PDF Version
- Credits
- Can High School Students Use Labor Market Information to Make Informed Career Choices?
- Long-Term Occupational Projections by Educational Level and Replacement Need: 2012 to 2022
- 2013 Publications from Research & Planning
- Map: Seasonally Adjusted Unemployment Rates, October 2013
- Wyoming Unemployment Rate Fell to 4.5% in September Then Rose to 4.6% in October 2013
- Current Employment Statistics (CES) Estimates and Research & Planning's Short-Term Projections, October 2013
- Wyoming Nonagricultural Wage and Salary Employment
- Campbell County
- Sweetwater County
- Teton County
- Nonagricultural Employment Growth Graph

- Nonagricultural Wage and Salary Employment Graph

- Economic Indicators
- Wyoming Total Nonfarm Employment
- Selected U.S. Employment Data
- Multiple Jobholders
- Discouraged Workers
- Part-Time for Economic Reasons
- Consumer Price Index
- Wyoming Building Permits
- Baker Hughes Rig Count

- Wyoming County Unemployment Rates
- Wyoming Normalized Unemployment Insurance Statistics: Initial Claims
- Statewide
- Laramie County
- Natrona County
- Statewide by Industry Graph

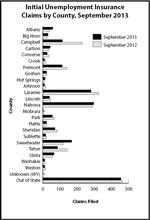
- Statewide by County Graph
- Wyoming Normalized Unemployment Insurance Statistics: Continued Claims
- Statewide
- Laramie County
- Natrona County
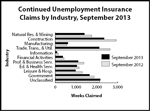
- Statewide by Industry Graph
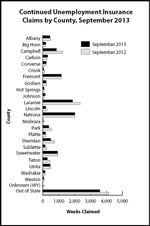
- Statewide by County Graph
- Map of Wyoming Regions, Counties, and County Seats with County Unemployment Rates


