Projections Methodological Note
Published December 2015.
On October 26, 2015, the long-term substate industry projections were removed from Research & Planning’s website. This was done in light of the recent declines in crude oil and natural gas prices and the associated changes in the state’s economy. Additionally, there was a tendency among some data users to take the projections data too literally instead of reflectively. For example, some data users might be tempted to interpret projected future employment levels as certain, rather than as “expected based on current trends.” Informed data users understand that projections represent a point in time estimate of the future direction of the state’s economy rather than a certain and absolute knowledge of future events.
Some general background information about the methodologies employed in developing the projections may help data users interpret and evaluate the projections data. The employment projections published by Research & Planning are produced under a grant from the Employment & Training Administration (ETA) as part of the Workforce Information Grant. Short-term (two-year) industry and occupational projections are produced each year and published in February. Long-term (10-year) projections are produced on a two-year cycle (2014-2024 projections will be published in June 2016).
The primary input used in developing both short-term and long-term industry projections is the Quarterly Census of Employment and Wages (QCEW) data from 1990 forward. These data are based on quarterly tax filings by employers and represent a virtual census of employment. The data are available at both the county and detailed industry level. Each quarter, R&P sends out a news release when the data are published (see http://doe.state.wy.us/lmi/qcewnews.htm). This news release provides the best information about trends in Wyoming’s economy and can be used in conjunction with projections to develop expectations of future employment levels. If, for example, the most recent projections suggest strong growth, but the most recent QCEW data show an overall decline in employment, data users should take notice. QCEW data are only one measure of demand for labor. Prudent users of projections consult other frequently published measures of demand produced by R&P and other entities.
Short-term projections
The short-term industry projections are developed using time series methods, with adjustments made based on analyst judgement and expected changes in the economy (including expected business closures, business openings, and other economic events). Standard software (Projections Suite) is used by Wyoming and most other states when developing their projections. The software uses several different models to produce a number of forecasts for each industry sector, and based on various factors, the analyst selects the one that seems to have the greatest likelihood of actually occurring. No one knows what will happen in the future, but for short-term projections, time series models can provide a reasonable forecast.

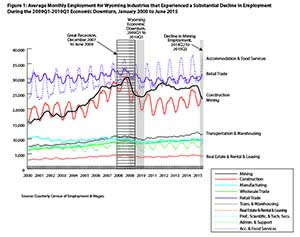
Figure 1 shows average monthly employment for Wyoming industries that experienced a substantial decline in employment during the 2009Q1-2010Q1 economic downturn. Reviewing the data in this figure can help data users better understand some of the hazards of projections based on time-series methods.
Imagine, for example, developing a projection for the mining sector in 2008. At that point, employment had been trending upward for nearly nine years, and most forecasting methods would have predicted that trend to continue into the future. However, in the real world, energy prices collapsed and employment declined as well. During the following several years, mining employment never again matched its November 2008 peak of 30,454 jobs, and another steep decline began in January 2015. Construction employment rose rapidly from 2004 to 2008, but then declined in 2009 and 2010 and did not return to its peak level.
In contrast to mining and construction, which have not returned to their peak employment levels, transportation & warehousing recovered more quickly and by December 2014, employment was approximately 1,500 jobs higher than its 2008 peak.
The most recent round of short-term projections, which were published in February 2015, utilized QCEW data from January 1990 through June 2014.
Changes in occupational replacement rate methodology
The occupational projections include not only the expected future employment level and growth openings for each occupation, but also the number of replacement openings expected over the projections period. For example, for registered nurses, from 2012-2022, there are expected to be 140 net new jobs, and additionally, we expect 155 openings for registered nurses to replace individuals who retire, die, or otherwise leave the profession. Thus, when individuals engage in career planning, they should be concerned not only with the number of growth openings, but also the number of job openings created when people currently working in that occupation leave it.
The U.S. Bureau of Labor Statistics has developed a new occupational separations methodology using different data sources. These new data will be introduced in December 2017 with the release of national employment projections. State data will be available in June 2018. The net effect of the new methodology is a large increase in the estimated number of occupational separations as individuals leave the labor force or transfer to other occupations. However, this change does not represent a change in our expectations, but rather a better understanding of the number of separations taking place in different occupations. For most occupations, the number of expected job opportunities arising from separations is much greater than the number of expected job opportunities from actual net employment growth.


