
Chapter 4: Workforce Satisfaction
by: Lisa L. Knapp, Research Analyst
Workforce satisfaction is a difficult concept to measure directly. In order to accomplish this, we used a series of scaled items (or statements about a condition or a perception) chosen because a review of the literature indicated they were useful for predicting employees’ intent to leave their jobs (for more discussion about how these scaled items were chosen, see http://doe.state.wy.us/LMI/SP_Report.pdf). In order to determine potential differences in response patterns to these scaled items for employees in all three agencies, we used the chi-square statistical technique, which is a descriptive form of analysis. This statistic allows us to determine if the response patterns to any of the questions differed significantly among agencies.
The following is a discussion of the results of this statistical analysis. It is divided into two sections: scaled items that did not have a statistically significant chi-square result but highlighted issues that were of concern for employees in all agencies; and scaled items that did have a statistically significant chi-square result, indicating items that showed significant differences between one or two agencies. This discussion contains only a sample of the scaled items included on the questionnaire; results for all scaled items can be found in Appendix B. Issues common to all agencies may be suitable for joint remediation plans.
Chi-Square Analysis
The chi-square statistic is used to determine whether or not the distributions of categorical variables differ from each other. It is essentially the measure of distance between the observed and expected responses. In this case, we expected the responses from the individual agencies to look the same as the total from all three. This statistic is used to calculate a p-value, or probability, which tells us if these differences are statistically significant. Any p-value that is less than or equal to 0.05 is considered statistically significant, indicating that there is a statistically real difference that is not due to chance. In this case, the chi-square value was used to identify significant differences in the responses of employees in the Wyoming Departments of Employment (DOE), Family Services (DFS), and Workforce Services (DWS). This is important as it may give agency heads insight into issues that are specific to their own departments, which, if altered, may increase employee satisfaction and tenure.
Important Satisfaction Issues That Do Not Differ Across Agencies
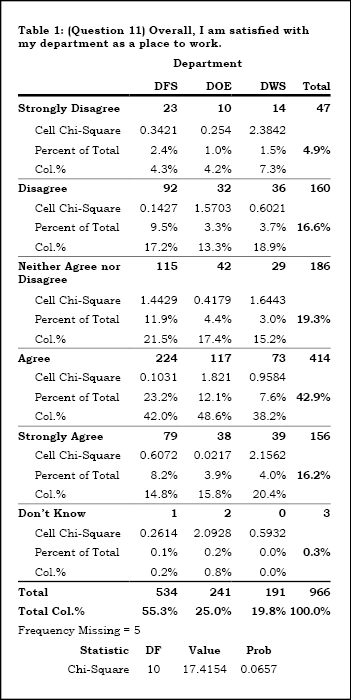
There were several variables that can be used to describe views, or consensus, of employees more generally. For instance, although question 11 (see Table 1, “Overall, I am satisfied with my department as a place to work”) did not have a significant chi-square result, which means there was no difference in answers for employees in each agency, more than 50% of all employees agreed or strongly agreed with this statement.
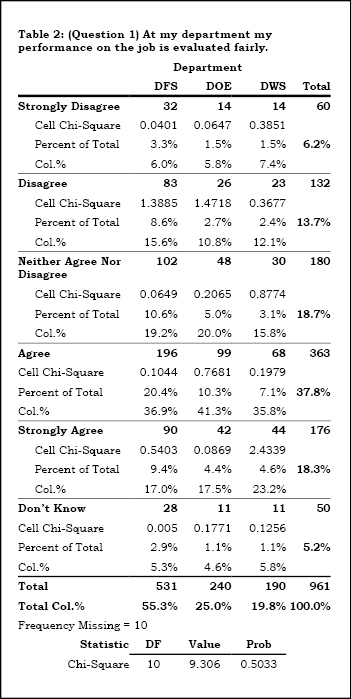
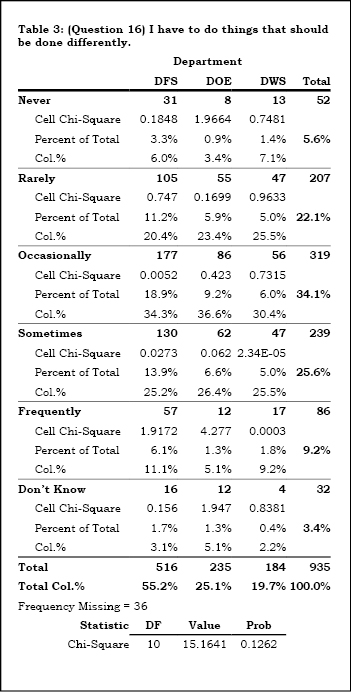
Question 1 (see Table 2, “At my department my performance on the job is evaluated fairly”) and question 16 (see Table 3, “I have to do things that should be done differently”) are both useful for describing the consensus among the three agencies even though neither of them showed significant differences among agencies. One in five employees disagreed or strongly disagreed that their job performance is fairly evaluated. Finally, more than one in three employees felt they sometimes or frequently do things at their jobs that should be done differently.
Although agencies lack the power to change all the factors that employees express dissatisfaction with, there are some things that can be changed internally. Question 8 (see Table 4, “My department does an adequate job of keeping employees informed about matters affecting us”) and question 9 (see Table 5, “In my department we can speak our minds without fear of reprisal”) are examples of these. Nearly one in three employees disagreed or strongly disagreed with questions 8 and 9. By promoting an internal system of openness between employees and management and by limiting retaliation (or the perception that retaliation will take place) toward employees who voice their opinions, an agency could potentially increase employee satisfaction and perhaps even retention.
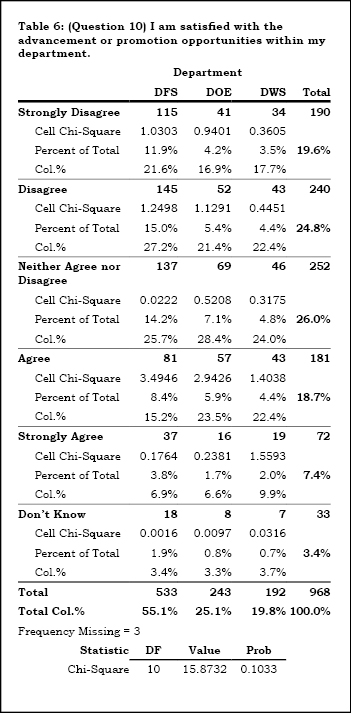
Another example is question 10 (see Table 6, “I am satisfied with the advancement or promotion opportunities within my department”) in response to which employees expressed dissatisfaction with promotional opportunities. While it is not entirely up to the agency how many positions are open for advancement or the structure of the classification system, these three agencies in particular share jobs with similar duties (e.g., benefits specialists) and could conceivably work with each other to advance employees into positions across agencies.
Job Training
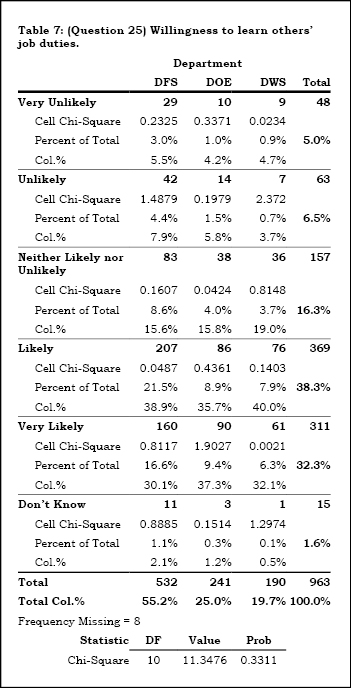
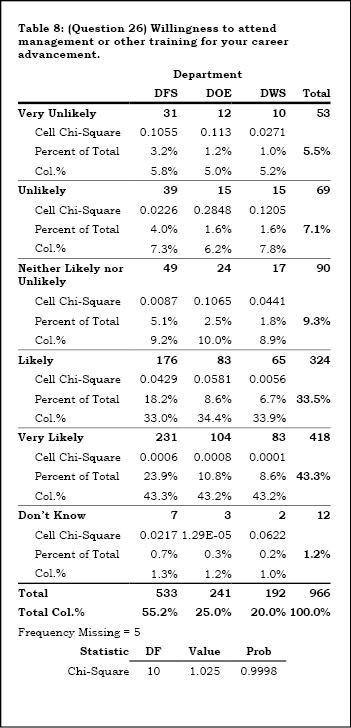
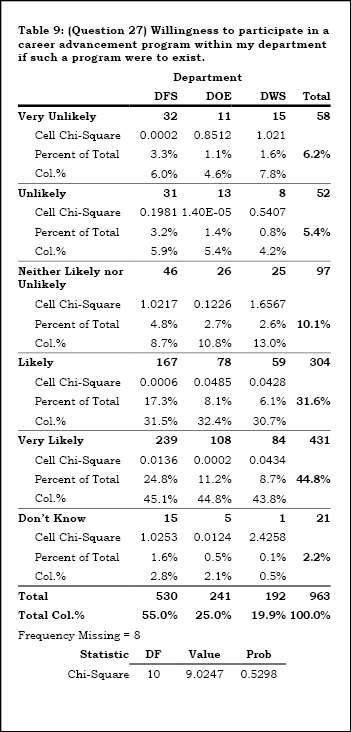
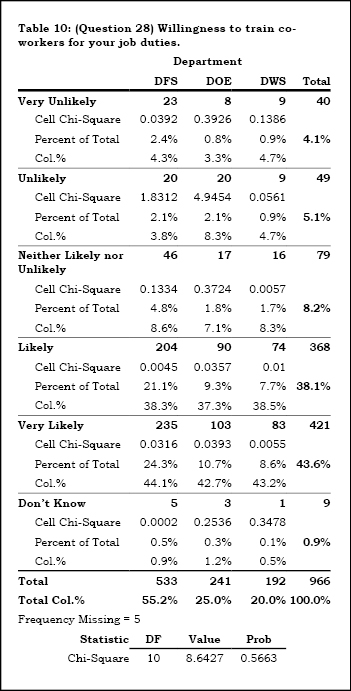
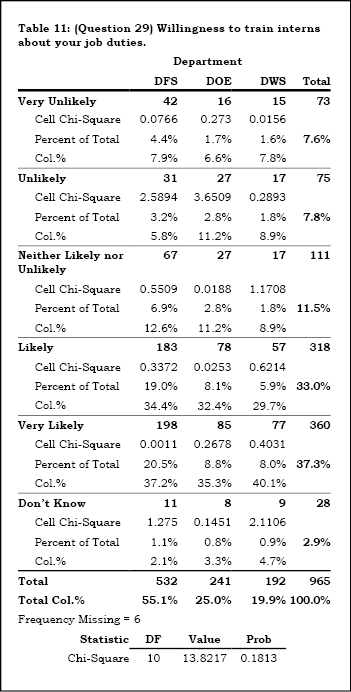
Employees were asked a series of questions related to their interest in receiving job training and in training their co-workers about their job duties. The responses to these questions did not differ significantly among agencies. A majority of all employees expressed at least some willingness to participate in these activities. More than two-thirds (70.6%) of employees said they would be likely or very likely to take part in learning others’ job duties (see Table 7), 76.8% said they would be likely or very likely to take part in management training (see Table 8), and 76.4% expressed some degree of interest in participating in a career advancement program (see Table 9). Also, 81.7% of all employees said they would be likely or very likely to train their co-workers for their job duties (see Table 10) and 70.3% said they would be at least somewhat likely to train interns about their job duties (see Table 11).
Compensation
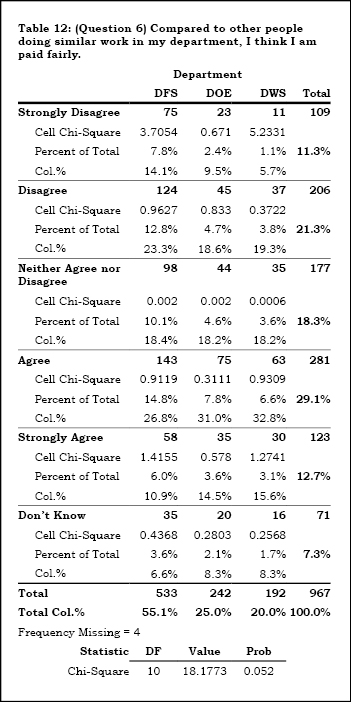
Employees were asked two questions regarding their satisfaction with pay. Question 6 (see Table 12, “Compared to other people doing similar work in my department, I think I am paid fairly”) did not differ significantly between agencies but can be used to describe overall satisfaction among the agencies with the existing pay system. Nearly one-third of respondents (32.6%) did not feel they were paid fairly compared to their peers.
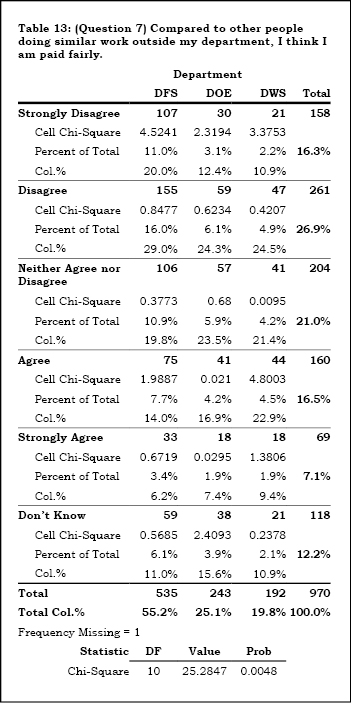
Question 7 (see Table 13, “Compared to other people doing similar work outside my department, I think I am paid fairly”) both describes the consensus and also yields evidence of the first statistically significant difference among agencies in this analysis. Overall, 43.2% of employees disagreed to some degree with this statement. This was especially true for workers in DFS: Nearly half (49.0%) of all employees disagreed with this statement. This difference in response compared to those in the other two departments affected the statistical significance of this particular chi-square test.
Important Satisfaction Issues That Show Differences Across Agencies
Job Performance
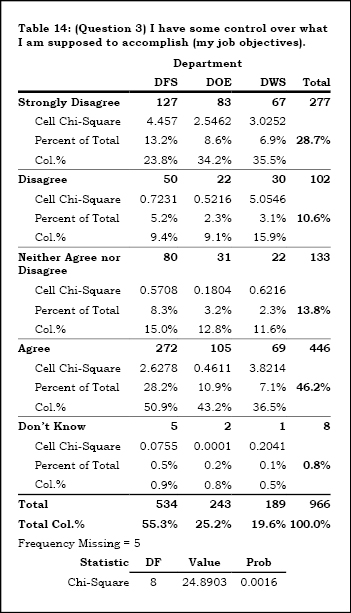
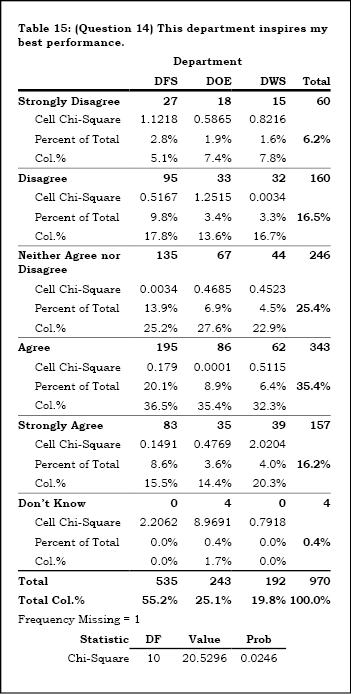
Two other scaled items both describe the system and were also statistically significant: question 3 (see Table 14, “I have some control over what I am supposed to accomplish [my job objectives]”) and question 14 (see Table 15, “This department inspires my best performance”). Overall, 40% of all employees disagreed or strongly disagreed that they have control over their jobs. DOE and DWS employees were more likely to feel this way (43.3% and 51.4%, respectively), but two-thirds of DFS employees agreed or strongly agreed that, indeed, they do have some level of control over their job objectives, affecting the statistical significance of this item. More than one-fifth (22.7%) of all employees disagreed to some extent that their department inspires their best job performance, but a quarter (24.5%) of those working for DWS disagreed or strongly disagreed with this statement.
The next chapter of this report includes a discussion regarding factor analysis (a means of grouping questionnaire items into theoretically relevant categories for predictive rather than descriptive analysis), which details how three groupings of variables, or factors, were created for the purpose of statistical modeling (see Chapter 5). Two of these three factors (social cohesion and barriers to job success) contain several scaled items that had statistically significant chi-square values, meaning there were distinguishable differences between departments. What is important is that there was a difference in response patterns for at least one department.
Social Cohesion
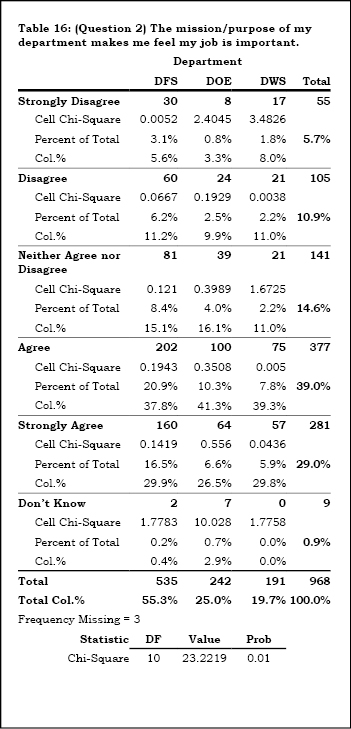
Several scaled items in the social cohesion factor showed statistically significant differences between departments. One of these was question 2 (see Table 16, “The mission/purpose of my department makes me feel my job is important”). There was very little difference among agencies except for DWS, where 8.0% of respondents indicated they strongly disagreed with this statement, compared to 5.6% of DFS employees and 3.3% of DOE employees.
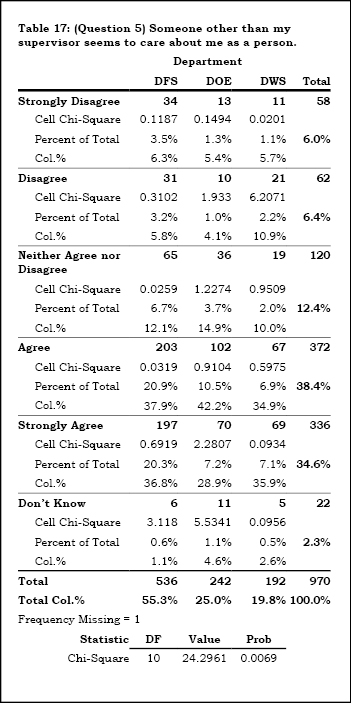
Another instance in which there was a significant difference between agencies was question 5 (see Table 17, “Someone other than my supervisor seems to care about me as a person”). Respondents in DFS and DOE gave similar answers to this question. However, a comparatively large proportion of DWS employees disagreed or strongly disagreed with this statement (16.6%).
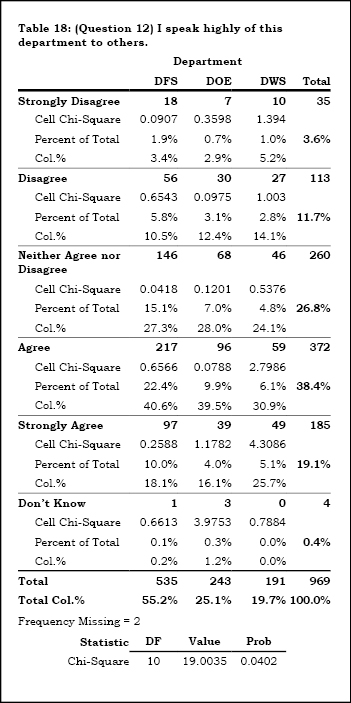
A third scaled item that had statistically significant results was question 12 (see Table 18, “I speak highly of this department to others”). Again, the responses from DOE and DFS employees were similar, but DWS employees gave significantly different answers. Moreover, in DWS, these responses were bimodal, meaning that DWS responses were grouped at opposite ends of the scale rather than at only one end or the other. Significantly more stated they disagreed or strongly disagreed with this statement (19.3%) compared to those in DFS (13.9%) or DOE (15.3%). There were also differences at the positive end of the scale, where a greater proportion of DWS employees indicated they strongly agreed with this statement (25.7%) than did employees in DFS (18.1%) or DOE (16.1%).
Barriers To Success
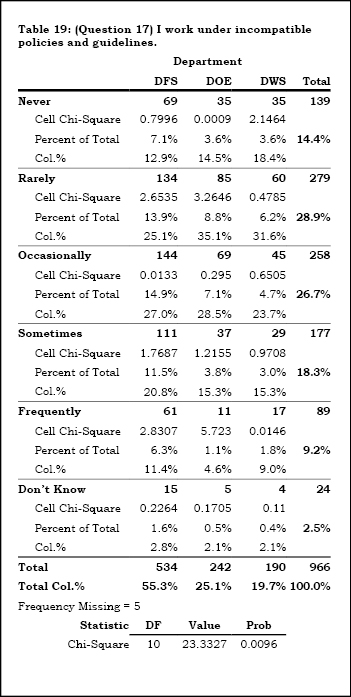
As previously mentioned, three scaled items within the barriers to success factor were statistically significant. One of these was question 17 (see Table 19, “I work under incompatible policies and guidelines”). DFS employees were most likely to indicate that this happens sometimes or frequently (32.2%). In contrast, DOE had the smallest proportion of employees responding that this is frequently the case (4.6%) and DWS employees had the largest proportion of those who felt this never happens (18.4%).
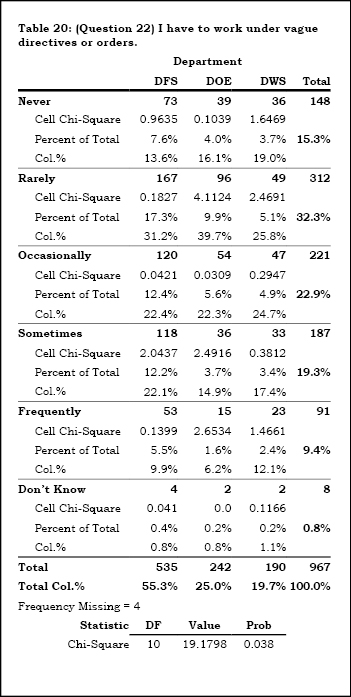
Question 22 (see Table 20, “I have to work under vague directives or orders”) was another instance where responses in one agency, DWS, were bimodal. DWS had the largest proportion of employees who responded that this is never the case (19.0%) and the highest proportion of respondents who said this frequently occurs (12.1%). In comparison, only 16.1% of DOE respondents and 13.6% of DFS respondents stated they never work under vague conditions and only 6.2% of DOE employees and 9.9% of DFS employees said this frequently happens.
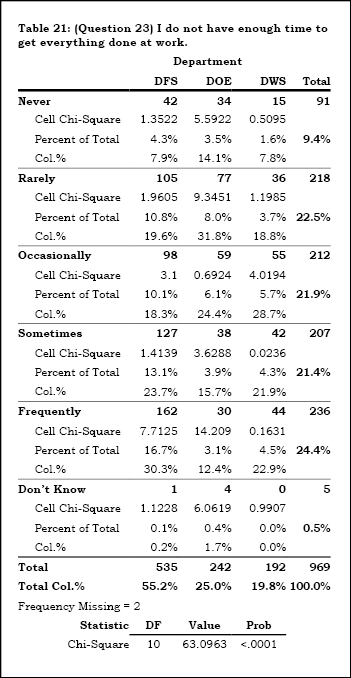
The third variable within the barriers to success factor that was statistically significant across agencies was question 23 (see Table 21, “I do not have enough time to get everything done at work”). There was a distinct difference between agencies, especially between DFS and DOE. More than half of DFS employees (54.0%) indicated they sometimes or frequently don’t have enough time to get their work done. In contrast, nearly half of DOE employees (45.9%) stated that this is rarely or never the case. It should be noted that the response among DOE employees may be partly due to Wyoming’s booming economy. As shown in the July 2008 issue of Wyoming Labor Force Trends, unemployment insurance claims had decreased between April and May and are at historically low levels.
Conclusions
As this analysis shows, there are some definite differences among agencies in terms of employee perception. Nevertheless, even when there is not a statistically significant difference among agencies, responses can give insight into issues that employees in all agencies feel are important. This analysis focused on the agency as the unit of analysis. The next section, which examines factor analysis and statistical modeling, focuses on the individual employee as the unit of analysis, in particular examining how responses to various questions are related to stated intentions to leave their department.