
Chapter 3: Demographics
by: Lisa L. Knapp, Research Analyst
This chapter includes analysis of the demographic make-up of employees in the Department of Family Services (DFS), the Department of Employment (DOE), and the Department of Workforce Services (DWS). This will include a break down of age, gender, family status, and education. These factors can affect how subjects view their workplace. For instance, single men may have a different opinion of what issues are important in the workplace than married women. Likewise, younger workers with less experience may have a different opinion about their employers than do older workers with more tenure. Understanding these demographic patterns will be useful because they help the reader understand and interpret the results offered in subsequent chapters.
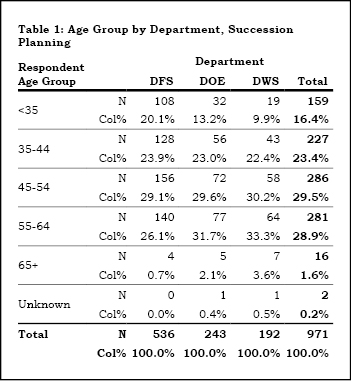
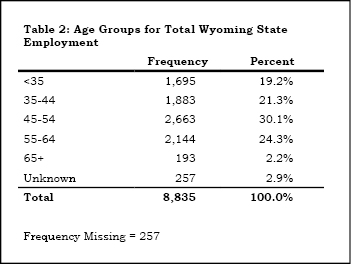
Overall, employees in DFS were younger than those in either of the other two departments (see Table 1). Almost half of DFS employees (44.0%) were younger than 45, compared to 36.2% of DOE employees and 32.3% of DWS employees. DWS employees had the greatest proportion of employees age 55 or older (36.9%). Among the three departments combined, 16.4% of employees were younger than age 35 and 30.5% were older than age 55. In comparison, 19.2% of Wyoming state employees (see Table 2) were younger than age 35 and only 26.5% were older than age 55. In summary, while there were almost twice as many younger workers in DFS, overall the employees of these three agencies are somewhat older than those working for the state as a whole. This could affect the generalizability of these results to the whole of state government because older workers and younger workers may have differing views of the workplace.
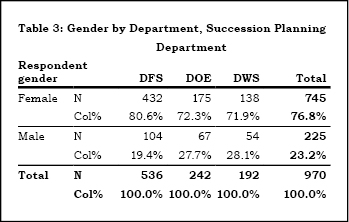
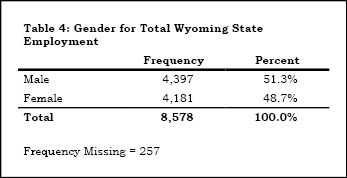
The majority of employees in the three agencies were female (76.8%; see Table 3). This proportion was greater in DFS (80.6%) than in DOE (72.3%) and DWS (71.9%). In comparison, a slightly greater proportion of total state employees were male (51.3%; see Table 4) than female (48.7%). Because there is a greater proportion of females to males working in these three agencies than in some other agencies and state government as a whole, we cannot generalize these results to the whole of state government. As with younger versus older workers, men and women often have different work experiences and therefore have differing views on workplace issues.
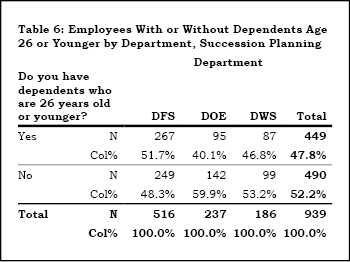
More than two-thirds of respondents in all agencies were married or living with someone during the time of the survey (71.7%; see Table 5). This was true for respondents in each agency as well. Nearly half of all respondents had children age 26 or younger (47.8%; see Table 6). This is important in that many insurance plans allow for the addition of dependent children under the age of 26 as long as the dependents are enrolled in school. The literature suggests that employees will be more inclined to stay in a job as long as they are providing health insurance for someone else, especially dependent children (Madrian, 1994). A somewhat greater percentage of DFS employees had children age 26 or younger (51.7%) than DWS employees (46.8%) or DOE employees (40.1%). This is most likely because DFS employees were typically younger than those in the other two agencies.
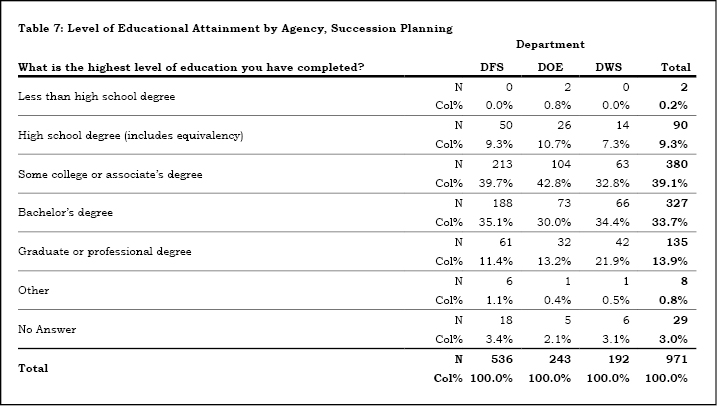
In total, 86.7% of employees in these three agencies had at least some college education (see Table 7). The greatest proportion of employees holding graduate or higher degrees was in DWS (21.9%). A larger proportion of DOE employees had some college or an associate’s degree (42.8%) or a high school diploma (10.7%) than in the other agencies.
References
Madrian, B.C. (1994). Employment-based health insurance and job mobility: Is there evidence of job-lock? The Quarterly Journal of Economics, 109(1), pp. 27-54. Retrieved September 4, 2008, from: http://www.belkcollege.uncc.edu/jtroyer/jtroyer_cr/madrian_1994.pdf