
Chapter 3: Methodology and Results
Introduction
The first chapter of this document, Saulcy (see Chapter 1) described in detail the economic and social context of Wyoming’s work environment from 2000 – 2008. This chapter further details the 2004 socioeconomic context first by analyzing the demographics of those who filed Workers’ Compensation (WC) claims and those who did not. The second part of the analysis involves the development of matched treatment and control groups. In one case, the control group consists of workers who did not file a WC claim in 2004 while the treatment group consists of workers who did file a WC claim in 2004. In the second case, the control group consists of WC claimants who only filed medical claims while the treatment group consists of WC claimants with more severe injuries. This information then provides a basis for analyzing differences in earnings (lost wages).
Methodology
The analysis focuses on persons who worked at any time for businesses covered by Unemployment Insurance in Wyoming during 2004 based upon administrative records. The frame of analysis includes approximately 90% of all workers in the state. The universe does not include persons employed in federal government, self-employment, production agriculture, and most railroad workers (see Appendix A for details). The project is further divided into WC claimants (claimants), and workers who did not file a WC claim in 2004 (non-claimants). If workers filed more than one claim during 2004, the more severe claim (according to Wyoming WC program rules) was used in the analysis. Wyoming WC staff provided the injury severity hierarchy upon request. The order of severity shown in the results tables ranges from lowest (Did Not File a WC Claim) to the highest (Death). Demographic data for both claimants and non-claimants were sourced from the WC episode file (collected from claim forms) and from the Wyoming Department of Transportation’s driver’s license database.
In order to equate wages and program costs for different years, all wages and costs were adjusted to constant 2008 dollars using the Consumer Price Index for All Urban Consumers (CPI-U, U.S. Department of Labor (n.d.)). Doing so allows the dollar amounts to be aggregated across several years and places them in the same frame of reference.
Although an analysis of claimant and non-claimant wages before and after 2004 provides insight into the effects of filing a WC claim on work histories, the demographic compositions of these two groups are not identical. Such a comparison would be invalid because of these differences. To control these differences, claimants were statistically matched to non-claimants on a case-by-case basis. Matching was accomplished in two steps. The first step involved controlling for demographics and earnings differences between claimants and non-claimants via a regression model. The model then generated an estimated probability that a worker was a claimant or non-claimant. These probabilities are called propensity scores. In the second step, claimants and non-claimants with the closest propensity scores were matched to produce control and treatment groups. For further details on the matching process see Appendix B. Following the development of the treatment (WC claimants) and control (non-claimants) groups, the next step involved analyzing claims patterns, and wage differentials regardless of injury severity. In a separate analysis, the same type of scoring and matching procedure was used to produce a second control group (medical claims only) and a second treatment group (more severely injured workers). The purpose of this analysis was to examine wage differentials between those two groups.
Results I: Demographics and Relative Risk
Table 1 summarizes the statewide
demographic context of the analysis. See 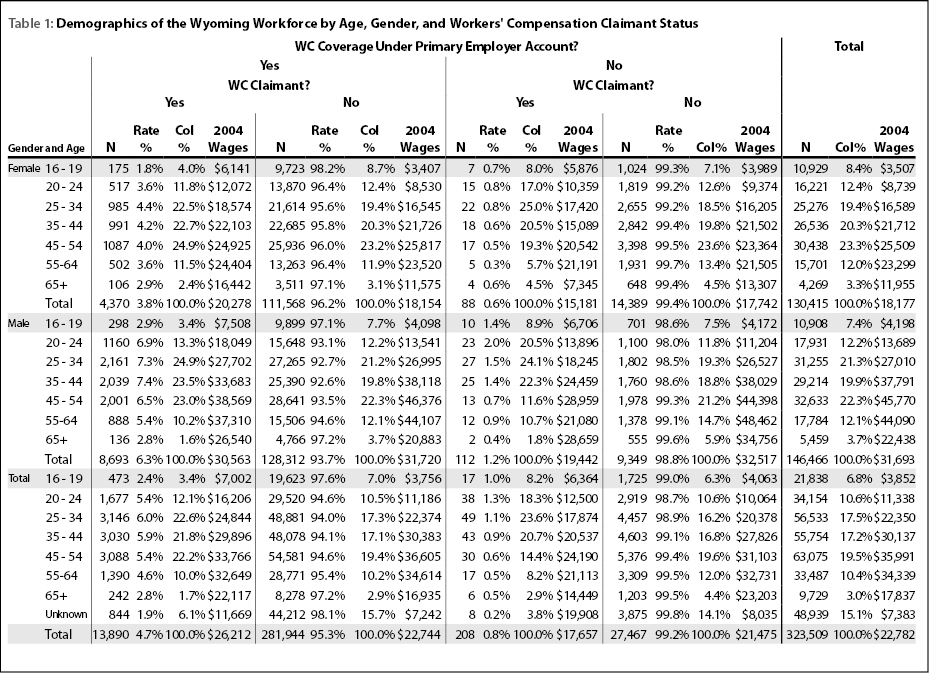 the glossary for a list of frequently used terms.
The focus of the remainder of this section will be workers covered by their
primary employer. The rate column indicates the rate at which claims were filed
for a particular age group and gender, or in total.
the glossary for a list of frequently used terms.
The focus of the remainder of this section will be workers covered by their
primary employer. The rate column indicates the rate at which claims were filed
for a particular age group and gender, or in total.
Overall, males were 1.65 times more likely to be injured and file a WC claim than females (6.3% of males compared to 3.8% of females). The age distribution of claims indicates that the greatest probability of WC-reported injuries for females was in the 25-34 age group (4.4%). The same finding did not hold true for male workers as their peak reported injury rate occurred among 35-44 year olds (7.4%). Note that average 2004 wages were greater for female claimants ($20,278) than for non-claimants ($18,154).1 This contrasts somewhat with males where non-claimants earned an average of $31,720 compared to $30,653 for non-claimants. This is an important distinction because of the traditional industries where men and women work. The male-skewed distributions of workers in relatively high-paying industries such as mining, construction, and manufacturing leads to the types of differences observed in claimant and non-claimant wages. This concept is detailed in a later section.
Figure 1 illustrates the distribution of female claimants
and non-claimants by  age. Claimants are proportionally less concentrated in
workers younger than 25 years of age and among workers 55 years of age or older.
However, claimants are proportionally more concentrated among workers between
25 and 54 years of age. Recall from Table 1 that workers in this age group
are generally the greatest wage earners, implying that female worker injuries
may be more damaging (greater loss of earnings and spending in the economy)
to individuals and society than if they occurred to younger or older female
workers.
age. Claimants are proportionally less concentrated in
workers younger than 25 years of age and among workers 55 years of age or older.
However, claimants are proportionally more concentrated among workers between
25 and 54 years of age. Recall from Table 1 that workers in this age group
are generally the greatest wage earners, implying that female worker injuries
may be more damaging (greater loss of earnings and spending in the economy)
to individuals and society than if they occurred to younger or older female
workers.
The distribution of male workers by claimant status is somewhat
different from female workers as shown in Figure
2. The distribution of
both claimants and non-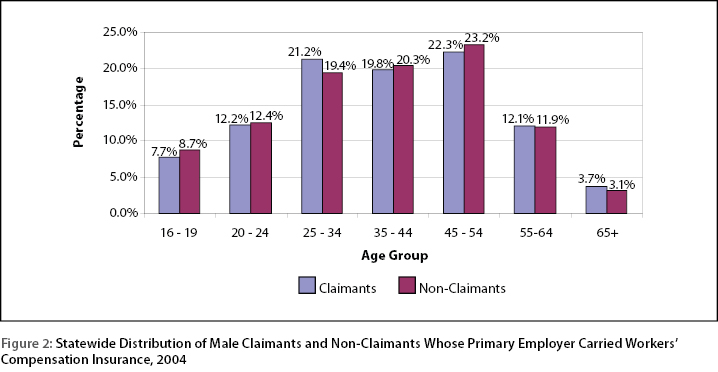 claimants is bi-modal. That is, it has one peak for
males 25-34 and another for males 45-54. Greater proportions of claimants occurred
in the 25-34, 55-64, and 65+ age groups. One major difference between Figures
1 and 2 is the proportion of claimants 16-19 years of age. The proportion of
males 16-19 is approximately twice that of females.
claimants is bi-modal. That is, it has one peak for
males 25-34 and another for males 45-54. Greater proportions of claimants occurred
in the 25-34, 55-64, and 65+ age groups. One major difference between Figures
1 and 2 is the proportion of claimants 16-19 years of age. The proportion of
males 16-19 is approximately twice that of females.
While the distributional differences provide some information
regarding male and female claimant populations, they become more striking when
analyzing claim-filing rates. Figure 3 shows that for all workers except for
those over 65, 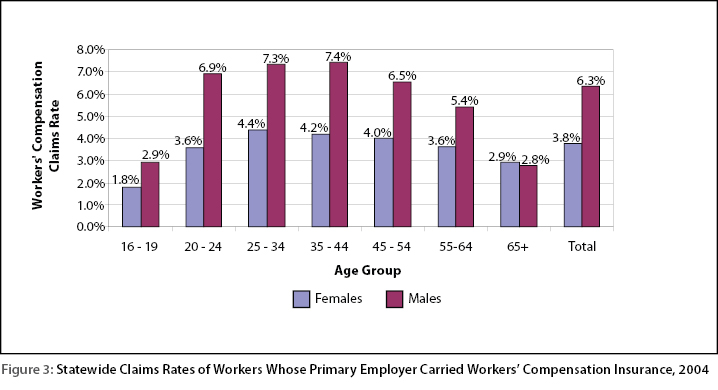 claims rates for males far exceed those of females. The difference
is largest among workers 20-24 where males are 1.91 times more likely to file
a claim than females (6.9% of males filed a claim compared to 3.6% of females).
Another feature of the chart is that reported injury rates peak for females
for 25-34 year olds, while the peak rate for males (7.4%) occurs for 35-44
year-olds.
claims rates for males far exceed those of females. The difference
is largest among workers 20-24 where males are 1.91 times more likely to file
a claim than females (6.9% of males filed a claim compared to 3.6% of females).
Another feature of the chart is that reported injury rates peak for females
for 25-34 year olds, while the peak rate for males (7.4%) occurs for 35-44
year-olds.
Male and female claims rates also differ considerably among
various industries. Figure 4 shows claims rates for three of Wyoming’s traditionally
male-dominated industries, mining, construction, and manufacturing. Although
males were only 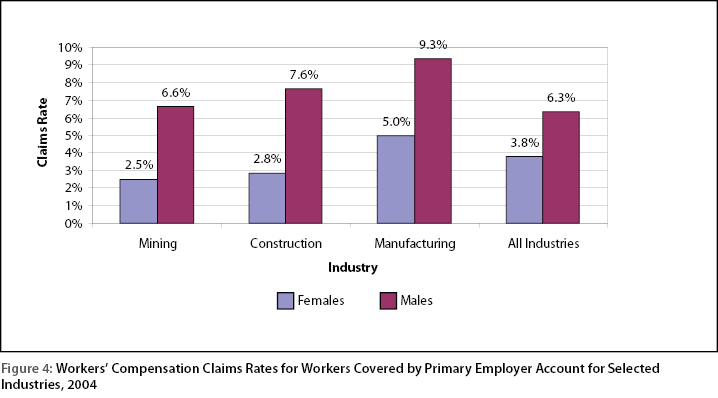 slightly more likely to file a claim in mining than in the
state as a whole (6.6% compared to 6.3%), they were 2.64 times as likely as
a female working in mining. The difference is even larger in construction,
where males were 2.71 times as likely to file a claim as female workers. However,
both male and female workers were more likely to be claimants in manufacturing
than either mining or construction. The risk ratio between males and females
in this industry was less (1.86 times) than mining and construction, but still
greater than all industries combined.
slightly more likely to file a claim in mining than in the
state as a whole (6.6% compared to 6.3%), they were 2.64 times as likely as
a female working in mining. The difference is even larger in construction,
where males were 2.71 times as likely to file a claim as female workers. However,
both male and female workers were more likely to be claimants in manufacturing
than either mining or construction. The risk ratio between males and females
in this industry was less (1.86 times) than mining and construction, but still
greater than all industries combined.
Results II: Wage Analysis, All Workers
This section examines demographic differences using gross
wages as a dependent variable. Figure 5 shows
that, for female workers, claimants on  average earn greater wages than non-claimants
except for 45-54 year-olds ($24,925 and $25,817, respectively). In some cases,
such as 16-19 year-olds, claimants earn an average of $1.80 for each $1.00
non-claimants earn. A similar scenario occurs for 20-24 year-olds ($1.41) and
workers 65 and older ($1.42). The exception to this finding was for 45-54 year-olds
where claimants on average earned $0.96 for each dollar non-claimants earned.
The picture is somewhat different for males as shown in Figure
6. For male
workers
average earn greater wages than non-claimants
except for 45-54 year-olds ($24,925 and $25,817, respectively). In some cases,
such as 16-19 year-olds, claimants earn an average of $1.80 for each $1.00
non-claimants earn. A similar scenario occurs for 20-24 year-olds ($1.41) and
workers 65 and older ($1.42). The exception to this finding was for 45-54 year-olds
where claimants on average earned $0.96 for each dollar non-claimants earned.
The picture is somewhat different for males as shown in Figure
6. For male
workers 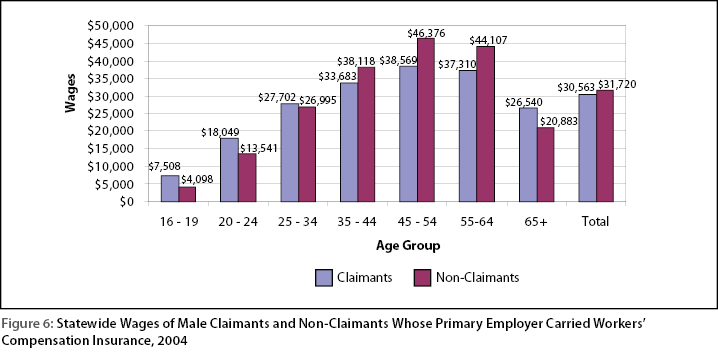 between 35 and 64 years of age, non-claimants earned between 13% (35-44)
and 20% (45-54) more than claimants did. In addition, the average earnings
for all male non-claimants ($31,720) exceeded that of male claimants ($30,563).
between 35 and 64 years of age, non-claimants earned between 13% (35-44)
and 20% (45-54) more than claimants did. In addition, the average earnings
for all male non-claimants ($31,720) exceeded that of male claimants ($30,563).
The industry summaries of average wages are shown in Figure
7. Claimant wages
exceeded non-claimant wages in both construction ($23,843 compared to $19,866)
and manufacturing ($31,558 compared to $30,898). Conversely, in mining non-claimant
wages ($44,588) exceeded claimant wages ($41,713).
$19,866)
and manufacturing ($31,558 compared to $30,898). Conversely, in mining non-claimant
wages ($44,588) exceeded claimant wages ($41,713).
Results III: Control Group Analysis, All Claimants
Table 2 details the treatment
and control group cases selected for the first analysis. The treatment group
is the WC claimants and the control group is the 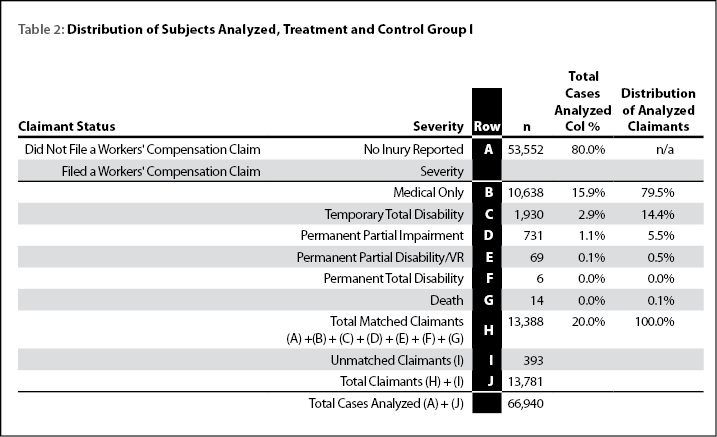 non-claimants. Four unique
control cases were matched to each treatment case. Thus, when the number of
treatments analyzed (Row J) is multiplied by four, the result is the number
of control cases shown in Row A. The number of treatment cases used is less
than the total number of available cases because 393 (2.9%) could not be matched
to control cases or an insufficient number of control cases were matched to
them. Rows B through G of Table 2 show the distribution of treatment cases
used in the first portion of the analysis. Note that 79.5% of treatment cases
were medical claims only (See Row B) and did not involve any type of disability
payments to injured workers. The remaining treatment cases (WC claimants) are
arranged in ascending order of injury severity in rows C through G. The vast
majority of more severely injured workers were classified as Temporary Total
Disability or Permanent Partial Impairment. Of the more than 13,000 injury
claims filed in 2004, only 14 resulted in worker deaths by 2008.
non-claimants. Four unique
control cases were matched to each treatment case. Thus, when the number of
treatments analyzed (Row J) is multiplied by four, the result is the number
of control cases shown in Row A. The number of treatment cases used is less
than the total number of available cases because 393 (2.9%) could not be matched
to control cases or an insufficient number of control cases were matched to
them. Rows B through G of Table 2 show the distribution of treatment cases
used in the first portion of the analysis. Note that 79.5% of treatment cases
were medical claims only (See Row B) and did not involve any type of disability
payments to injured workers. The remaining treatment cases (WC claimants) are
arranged in ascending order of injury severity in rows C through G. The vast
majority of more severely injured workers were classified as Temporary Total
Disability or Permanent Partial Impairment. Of the more than 13,000 injury
claims filed in 2004, only 14 resulted in worker deaths by 2008.
Note that for 2004, 14,098 WC claims were filed (see Table 1). However, the analysis focuses only on the left half of the table (13,890 claims). Of the 13,890 WC claims shown in the left half of Table 1, only 13,781 (Row J) were available for further analysis. The difference between the 13,781 shown in Table 2 and the 13,890 shown in Table 1 was primarily due to claim rejections.
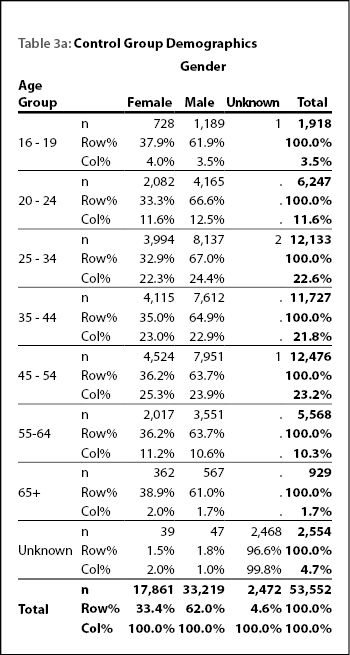 Tables 3a and 3b (see
page 37) compare treatment and control grouppopulations on age and gender dimensions.
The goal of matching is to create a control group, which is identical to the
treatment group on every control variable. The row and
Tables 3a and 3b (see
page 37) compare treatment and control grouppopulations on age and gender dimensions.
The goal of matching is to create a control group, which is identical to the
treatment group on every control variable. The row and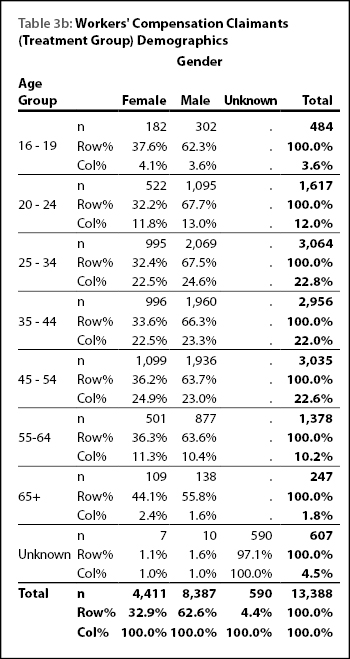 column percents of the
two tables tell us how effective the process was. For example, Table 3a shows
that forfemales age 20-24, the row percent is
33.3% and the column percent is 11.6%. The same cell in Table 3b (treatment
group) has a row percent of 32.2% and a column percent of 11.8%. This result
indicates a very close match. The remaining table cells show much the same
results.
column percents of the
two tables tell us how effective the process was. For example, Table 3a shows
that forfemales age 20-24, the row percent is
33.3% and the column percent is 11.6%. The same cell in Table 3b (treatment
group) has a row percent of 32.2% and a column percent of 11.8%. This result
indicates a very close match. The remaining table cells show much the same
results.
Table 4 displays the results
when comparing wages for the treatment and 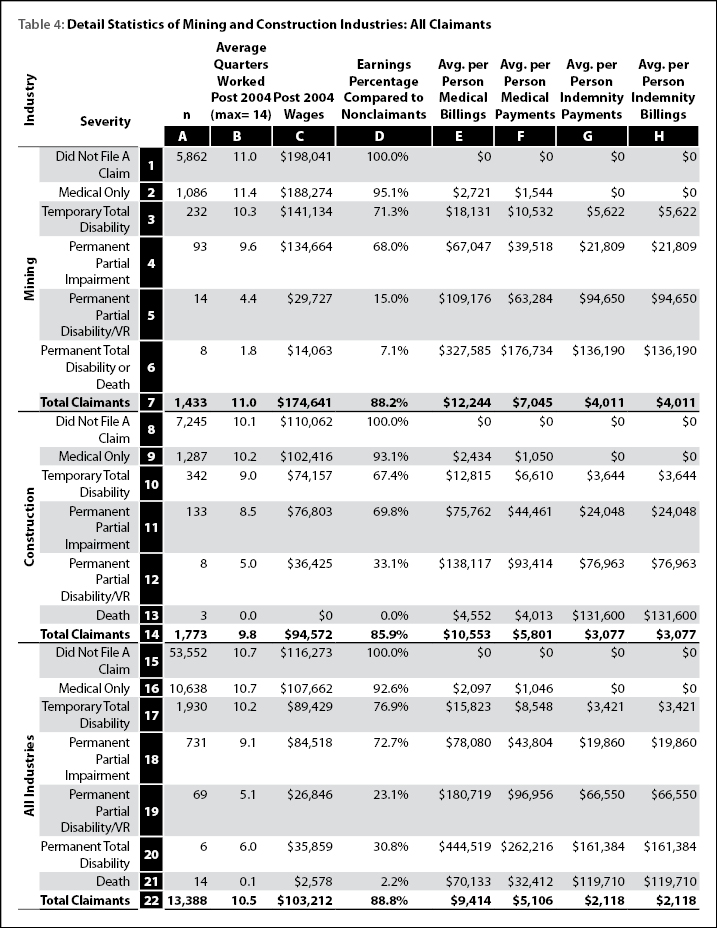 control groups. The rows and columns
of the table are labeled to facilitate ease of use. Results for mining and
construction are shown as are the statewide totals. The analysis begins with
the All Industries section (Rows 15 – 22), then proceeds to mining (Rows 1
– 7) and then construction (Rows 8 – 14).
control groups. The rows and columns
of the table are labeled to facilitate ease of use. Results for mining and
construction are shown as are the statewide totals. The analysis begins with
the All Industries section (Rows 15 – 22), then proceeds to mining (Rows 1
– 7) and then construction (Rows 8 – 14).
Row 15 shows the all industries results for the control group, workers who did not file a claim. These 53,552 people worked an average of 10.7 quarters of the maximum 14 quarters between first quarter 2005 and second quarter 2008. Row 16 shows that the 10,638 claimants filing medical only claims also worked an average of 10.7 quarters. However, their real average total earnings were $107,662 or 92.6% of non-claimants.2 If a worker incurs more debilitating injuries, wages decline rapidly as shown in cells D17 – D21. The greatest decline in wages occurs when injury severity increases from Permanent Partial Impairment (PPI) to Permanent Partial Disability (PPD).
How do PPI workers fare when it comes to wage replacement (see Glossary for definition)? This can be estimated by subtracting the average PPI wages (C18) from the non-claimant average wages (E15) = $31,755/person. The estimated replacement from the indemnity payments (G18) averages $19,860/person. The estimated replacement shortfall is $11,895. This amount does not include insurance deductibles or other out-of-pocket claimant costs. Similar calculations can be performed for other groups of claimants.
In the matched sample, 10.7% of WC claims occurred in mining (A7/A22). Although
the average number of quarters worked (post-2004) was nearly the same as for
all workers (11.0 and 10.7, respectively), the wage differences for mining
workers in total and the three least severe injury categories (F2 – F4 compared
to F16 – F18) were much greater than in construction. Using the same replacement
wage methodology described previously, the estimated replacement wage shortfall
for PPI injuries in mining was estimated to be $41,560 per worker.
Rows 8 – 14 show the results for construction workers. Note that the average
post-2004 wages in addition to the average quarters worked tended to be less
for construction workers than for those in mining or for all industries combined.
The seasonal nature of construction work is likely one contributor to this
result. One difference between PPI workers in construction and mining is that
PPI worker average wages ($76,803) were greater than workers having a temporary
total disability (TTD, $74,157).
Results IV: More Severely Injured Workers’ Demographics
Table 5 displays the counts of treatment (more severely injured workers) and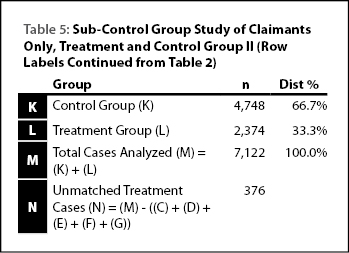 control cases (medical claims only). The treatment group for this portion of
the analysis is a subset of the injured workers shown in Table 2. In this example,
two control cases were matched to each treatment case. The total number of
matched treatment cases was 2,374 (Row L). The corresponding number of control
cases was 4,748 (Row K). The number of unmatched treatment cases was 376 or
13.6% of the available cases (Row N).
control cases (medical claims only). The treatment group for this portion of
the analysis is a subset of the injured workers shown in Table 2. In this example,
two control cases were matched to each treatment case. The total number of
matched treatment cases was 2,374 (Row L). The corresponding number of control
cases was 4,748 (Row K). The number of unmatched treatment cases was 376 or
13.6% of the available cases (Row N).
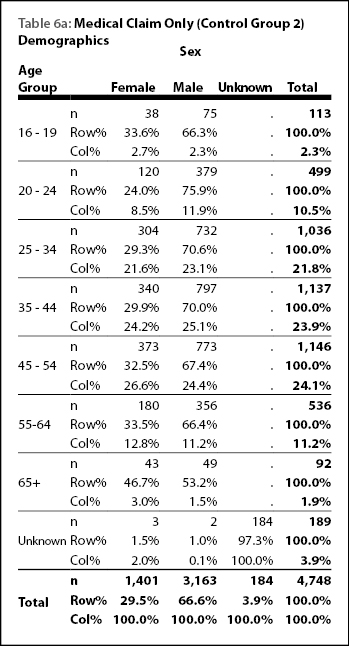 Tables 6a and 6b (see
page 40) illustrate the demographic distributions of thesecond
treatment (more severely injured claimants) and control groups (medical only
claims). Again, the cell for females age 20-24
Tables 6a and 6b (see
page 40) illustrate the demographic distributions of thesecond
treatment (more severely injured claimants) and control groups (medical only
claims). Again, the cell for females age 20-24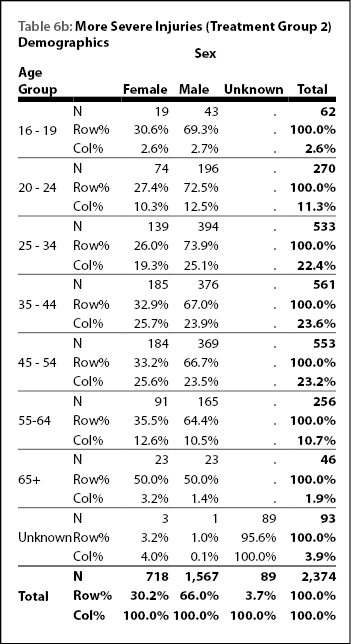 is the example. The row and
column percents for this cell in Table 6a (control group 2) are 24.0%and 8.5%.
They are somewhat different than the 27.4% (row) and 10.3% (column) shown for
the treatment group (Table 6b). The percentages do not match as closely as
when using all available cases because there is a much smaller group of control
cases available for matching. Therefore, a difference of a small number of
cases more substantially influences the distribution percentages.
is the example. The row and
column percents for this cell in Table 6a (control group 2) are 24.0%and 8.5%.
They are somewhat different than the 27.4% (row) and 10.3% (column) shown for
the treatment group (Table 6b). The percentages do not match as closely as
when using all available cases because there is a much smaller group of control
cases available for matching. Therefore, a difference of a small number of
cases more substantially influences the distribution percentages.
Results V: Matched Control Group Analysis, More Severe Injuries
Table 7 shows the results
of when we further subset WC claimants into more  severe injuries (treatment
group) and medical only injuries (control group). The total counts of the two
groups shown in Rows 7 – 9 match those shown in Tables 6a and 6b. The earnings
loss because of a more severe injury appears to be more acute for mining workers
than construction workers. Column F shows that employees in mining with more
severe injuries earned 83.7% of mining workers with a medical claim only. Similarly,
construction employees with more severe injuries earned 86.6% of the construction
worker wages with medical claims only. Not only do mining workers lose a greater
proportion of potential earnings due to more severe injuries, they tend to
work fewer quarters following injury occurrence. The average number of quarters
worked post-injury was 1.1 less in mining3 and 0.9 less in construction4 compared to those with medical claims only. In addition, the earnings losses
in construction and mining tended to be larger on a percentage basis than all
injured workers when severity was greater than medical only claims.
severe injuries (treatment
group) and medical only injuries (control group). The total counts of the two
groups shown in Rows 7 – 9 match those shown in Tables 6a and 6b. The earnings
loss because of a more severe injury appears to be more acute for mining workers
than construction workers. Column F shows that employees in mining with more
severe injuries earned 83.7% of mining workers with a medical claim only. Similarly,
construction employees with more severe injuries earned 86.6% of the construction
worker wages with medical claims only. Not only do mining workers lose a greater
proportion of potential earnings due to more severe injuries, they tend to
work fewer quarters following injury occurrence. The average number of quarters
worked post-injury was 1.1 less in mining3 and 0.9 less in construction4 compared to those with medical claims only. In addition, the earnings losses
in construction and mining tended to be larger on a percentage basis than all
injured workers when severity was greater than medical only claims.
Earnings replacement for more severely injured workers demonstrates a usual pattern (see Table 4). Overall, more severely injured workers made an average of $11,848 less than those with medical claims only (Table 7: C7 – C8). The average amount replaced was $9,303 (C7 – C8 – G8). Dividing that quantity by the lost wages reveals that 78.5% of the wage difference between medical only claims and more severe injuries was replaced. Repeating the same calculations for mining and construction yields a differential replacement ratio of 84.9% (construction) and a differential replacement ratio of 45.4% in mining.
Conclusion
In this pilot study, matched control groups were used to analyze differences in wages earned when comparing claimants to non-claimants in addition to comparing different types of claimants to each other. The propensity scoring and matched control group strategy allows for direct comparisons because the influence of confounding variables is largely removed from the analysis. The pilot study demonstrates Research & Planning’s unique ability to acquire and integrate multiple administrative data sets in both cross-sectional and longitudinal methods to enhance policymakers’ understanding of workforce injuries and their effects on workers, their families and the economy.
Future studies will include a more complete analysis of the cost components in the WC system. Furthermore, medical costs and lost wages by occupation will be explored in the development of models to help mitigate the most costly injuries. The quantification of the cost element illustrates in which industries and in some cases, which occupations are more likely to incur the greatest cost to society, not only in dollars lost, but in lost lives as well.
References
Allison, P. (1999). Logistic Regression Using SAS: Theory and Applications. SAS Institute Inc., Cary, NC, USA.
Parsons, L. (2004). Performing a 1:N Case-Control Match on Propensity Score. SAS Institute Inc 2004. Proceedings of the Twenty-Ninth Annual SAS Users Group International Conference. Paper 165-29. SAS Institute, Inc., Cary, NC. Retrieved January 30, 2009 from http://www2.sas.com/proceedings/sugi29/165-29.pdf.
U.S. Department of Labor, Bureau of Labor Statistics. (February 15, 2008). Quarterly Census of Employment and Wages. Frequently Asked Questions. Retrieved April 13, 2009 from http://www.bls.gov/cew/cewfaq.htm.
U.S. Department of Labor, Bureau of Labor Statistics. (n.d.) Consumer Price Index. CPI Databases. Retrieved January 30, 2009 from http://www.bls.gov/cpi/data.htm.
1
All wage amounts referenced in this document are pre-tax gross wages per person.
2 Student’s t-test was significant at the p≤.001. See Appendix
C for details.
3 Student’s t-test was statistically significant at p≤.001. See Appendix C for
details.
4 Student’s t-test was statistically significant at p≤.01. See Appendix C for
details.