Chapter 2: Wyoming’s Labor Market in Context
Wyoming, like many western states, has strong historical economic and cultural ties to natural resources. Jobs in mining and construction, both of which are growing industries in the state, are physically demanding and present more risk of injury than many jobs. This research uses injury data for 2004 from the Wyoming Workers’ Compensation (WC) claims file in conjunction with other data to identify earnings losses of injured workers when compared to similarly employed workers. Because of their importance to Wyoming, we focus on the natural resources & mining (mining in particular) and construction industries. These industries experienced incidence rates of nonfatal injuries in 2004 that were higher than the national average (U.S. Department of Labor, Bureau of Labor Statistics, n.d.). For methodological reasons, we also focus on a sector of the health care industry. Despite the inherent risks of working in mining and construction, the seriousness of injuries can, to a large extent, be controlled through preventative efforts (Chelius, 1991). By focusing on workers at greatest risk for high-cost injuries, surveillance and preventative measures may be instituted to reduce the probability of injury.
In this section we discuss how the dynamics of the state’s
economy influenced the factors available for analysis, shown in Table
1.
These variables are  conditions of the circumstances associated with injury
rather than proximate factors associated with the event. Because our reference
period is a single year, 2004, other unmeasured yet relevant factors (e.g.,
weather conditions unique to Wyoming) may change, limiting our ability
to generalize the results and necessitating study replication. These other
factors may interact with age, gender, and other factors.
The Labor Force in General
Figures 1 and 2 show
the changing state of Wyoming’s labor force from 2000-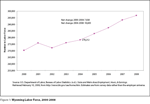 2008.
Figure 1 illustrates labor force estimates,
while Figure
2 shows the unemployment rate. Wyoming’s economy in
2004 was in the midst of an economic expansion. Growth in the labor force
from 2000 to 2004 was more moderate than from 2005 to 2008. Research suggests
a link between employee tenure and the
  likelihood of injury. Tenure itself
may be affected by economic growth (see for example Smith, de Hoop, Marx, & Pine,
1999; Rinefort & Van Fleet, 1998). An influx of inexperienced workers
in a relatively short time could result in higher-than-average injury rates.
Figure 1 shows that Wyoming added 7,938 people to the labor force (the sum of employed and unemployed) from 2000 to 2004 (270,274 to 278,212). Labor force growth accelerated following 2004, with the labor force growing by 18,600 to 296,812 in 2008.
The unemployment rate for Wyoming ranged from a high of 4.0% in 2003 to a low of 2.6% in 2006 (see Figure 2). From 2003 to 2004, the unemployment rate fell by 0.7 percentage points to 3.3%. While the labor force was growing, unemployment declined. This was especially true from 2005 to 2006, when the labor force grew by 1.6% and the unemployment rate stood at 2.6%.
Wyoming is one of five states (the four others are Ohio, North Dakota, Washington, and West Virginia) in which the state is the exclusive workers’ compensation insurance provider (National Academy of Social Insurance, 2008). There are some exceptions to the state monopoly, not all of which are long term. For example, in 2006, the National Academy of Social Insurance (NASI; 2008) estimated that 783 private carriers provided workers’ compensation insurance in Wyoming. Yet in 2005, there were no private providers (for further discussion, see Workers’ Compensation: Benefits, Coverage, and Costs, 2006 at http://www.nasi.org/publications2763/publications_show.htm?doc_id=702308&name=Disability).
Despite the near-monopoly on workers’ compensation insurance, not all employees in the state are covered by workers’ compensation. Exceptions include but are not limited to employees of private households, most employees of agriculture operations, and student employees of schools and colleges. In some instances, however, employers may elect to acquire Wyoming Workers’ Compensation coverage for their employees (Wyoming Workers’ Compensation Act, 1986). As a result, our study is not an exhaustive evaluation of workplace injuries and costs in the state, although the vast majority of Wyoming employees are covered.
Natural Gas Prices
After 2004, Wyoming experienced the most pronounced period
of economic growth since the 1970s. The growth resulted in large part from
higher energy  prices, and natural gas prices in particular. Figure
3 shows
monthly U.S. natural gas wellhead prices and Wyoming marketed production
from January 2000 to October 2008. The lowest price was $2.19 per thousand
cubic feet (mcf) in February 2002. Prices rose steadily, and by July 2004
had increased to $5.62 per mcf, more than double the February 2002 price.
Prices nearly doubled yet again by June 2008 to $10.82 per mcf. Correspondingly,
production in Wyoming steadily rose over the eight-year period. Production
at its highest level in July 2008 (197,462 million cubic feet; MMcf) was
more than twice what it had been in February 2000 (84,714 MMcf).
Industry Employment and Wages
Wyoming’s goods- and services-producing industries
grew at 3.2% and 5.0%, respectively, from 2001 to 2004 (see Table
2a).
From 2004 to 2008, however, 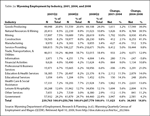 goods-producing industries had a marked advantage
in employment growth over most other industries. Jobs worked in natural
resources & mining
rose from 20,413 in 2001 to 22,239 in 2004, the bulk of which was in the
mining subsector. Employment growth was even more pronounced from 2004
to 2008 in natural resources & mining, with jobs rising by 8,930 (45.4%)
to 28,619.
Growth in the construction industry was substantially lower from 2001 to
2004 compared to 2004 to 2008 (see Table
2a). From 2001 to 2004 employment
grew by 412 (2.1%). Conversely the construction industry outpaced the natural
resources & mining industry from 2004 to 2008 with growth of 41.3%
(8,253 jobs).
Part of the growth in construction was tied to mining
through the construction and expansion of natural gas pipelines (Bleizeffer
2006). Figure 4 shows the  distribution of jobs worked in construction subsectors.
The share of jobs worked in heavy construction grew from 24.1% in 2001
to 33.1% in 2008. Firms in this subsector are primarily engaged in infrastructure
construction and include, among other types of firms, those engaged in
oil and gas pipeline and related construction. This construction directly
supports oil and gas firms by providing them with the capacity to export
their products.
In response to the tighter labor market, wages grew significantly
from 2001 to 2008. Figure 5 shows average weekly wages for 2001,
2004, and 2008 for all industries, and for construction and mining separately.
Wage growth statewide 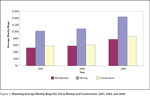 was more moderate from 2001-2004 than from 2004-2008.
In 2001, average weekly wages were $527. By 2004 wages had risen to $586,
a gain of $59. By 2008 average weekly wages went up to $780, an increase
of $194 from 2004.
With natural gas extraction the primary driver, wages rose even more in the mining industry than average wages for all industries. Average weekly wages in natural resources & mining rose by $66, from $1,023 in 2001 to $1,089 in 2004. By 2008, the average weekly wage increased to $1,440, which was $471 higher than the average weekly wage in 2001.
Wage increases were less pronounced in construction than in mining for both the 2001-2004 and 2004-2008 periods. The rise in the average weekly wage from 2001-2004 for mining was slightly more than double that of construction ($66 compared to $32). Although net wage gains in mining were also higher than construction from 2004-2008, the percent change for construction was greater during this period. The average weekly wage in mining rose by $351 from 2004 to 2008 compared to $254 for construction. On a percentage basis, mining wages rose by 32.2% while the change in the construction wage was 41.2%.
Turnover
High turnover rates have been linked to increased rates of worker injury
(Smith, de Hoop, Marx, & Pine, 1999; Rinefort & Van Fleet, 1998).
Figure 6 shows the percentage of Wyoming
workers who exited employment with an employer 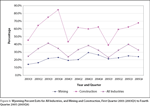 for first quarter 2003 (2003Q1)
to 2005Q4 (for a discussion of turnover definitions, see Leonard, 2006).
During this period, the percentage of Wyoming workers who left their employer
ranged from approximately 25% to 40%. Mining had a lower-than-average percentage
of exits while construction was significantly higher than average. The
percentage of exiting workers in construction ranged from a low of 39.0%
in 2005Q1 to a high of 84.8% in 2003Q4. Much of the exiting pattern in
construction can be attributed to the seasonality of the industry (Lukasiewicz
and Tschetter, 1983). Mining, which had the lowest percentage of exits
in 2003Q1 and 2003Q2, was not immune from the increased turnover associated
with the economic expansion. Over the 12 quarters, exits in mining went
from 14.3% in 2003Q1 to 24.0% in 2005Q4.
Demographic Characteristics
On average, younger workers in Wyoming were injured more often on the job than their older colleagues in 2004 (see discussion). We anticipate the rate of employee injuries will decline as the average age of the workforce increases. However, declining injury rates may be less extensive in an economic expansion because of higher turnover rates.
Table 3 shows the distribution of employment by age group
for all people employed at any time in Wyoming in 2000, 2004, and 2007.
Between 2000 and  2007 the percentage of employees for whom demographic
characteristics are not known increased. The percentage of these employees
in Wyoming’s work force has grown steadily since the mid-1990s (Jones,
n.d.). For current research purposes, this trend has two consequences.
First, the absence of demographic characteristics limits our ability to
create control groups based on these characteristics. Second, it restricts
our ability to generalize our findings to the overall population. These
limitations are especially problematic for industries such as construction
that rely heavily on workers with limited attachment to the state.
In addition, the percentage of workers age 35 and under fell relative to older workers and those without known demographics. The decline was especially pronounced for workers 35-44. In 2000, 21.6% of employment was in this age group. By 2004 it had fallen to 17.3%, and to 14.6% in 2007.
As with the age distribution overall, the share of employment
without known demographics increased in the natural resources & mining
industry (see Table 4). Unlike
the overall distribution, the percentage of younger workers in natural
resources & mining, in particular workers
age 25-34, grew from 17.2% in 2000 to 19.0% in 2008.
The construction industry by far employed the most workers
without known demographics (see Table 5). In  2004 approximately one-fourth
of construction employees had no known demographics; by 2007 close to half
(45.1%) of all workers in the construction industry were in this category.
The lack of demographics for a substantial portion of the construction
workforce exemplifies the issues associated with control groups and results
generalization discussed earlier.
By age group, the biggest overall wage increase was for
workers age 55-64 (see Table 6). From 2000 to 2004, the average
annual wage rose by $6,608,  from $27,307 per year to $33,915. Individuals
in this age group saw even larger wage gains from 2004 to 2007, with the
average annual wage rising by $8,002 to $41,917.
The proportion of men employed in Wyoming increased gradually
from 2000 to 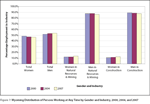 2007 (see Figure 7). In 2000, men constituted 51.7%
of employment; by 2008 they accounted for 53.6% of all workers. Despite
gains by women in construction and natural resources & mining, men
made up nearly 90% of employment in these two industries.
Workers’ Compensation Claimants’ Characteristics
Table 7 shows the demographic characteristics
and wages of Wyoming 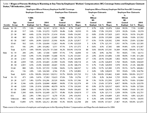 Workers’
Compensation claimants and non-claimants working at any time on the basis
of their primary employers’ workers’ compensation coverage status. The
discussion in this chapter is limited to employee claimants whose primary
employer had coverage under the Wyoming Workers’ Compensation system. The
mining and construction industry subsets are detailed in Tables 7 and 8, respectively. These three tables describe
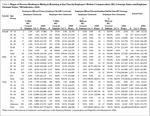 the industry,
demographics, and earnings characteristics from which control and treatment
groups will be selected as described in the next chapter.
A total of 13,890 employees working for employers with workers’ compensation coverage made claims in 2004. Men made twice as many workers’ compensation claims as women did. A total of 8,693 men made claims for Workers’ Compensation, while women made 4,370 claims. Although women accounted for 47.1% of total employment in 2004 (see Figure 7), just under one-third of workers’ compensation claimants were women.
Furthermore, the wages of men who were claimants were
higher by about $10,000 than the wages of claimants who were women. For
the highest wage claimant group, men age 45-54, annual wages were more
than $13,000 higher than for women of the same age ($38,569 compared to
$24,925). Male claimants earned an average of $30,563 annually compared
to $20,278 for female  claimants, a difference of $10,285. In comparison
the difference between all employed men and women was $13,569 ($31,813
compared to $18,244; see Figure 8).
Of the 1,512 Workers’ Compensation-covered claimants
in the mining industry, 1,347 (89.1%) were men. This proportion is slightly
higher than the proportion of men employed in natural resources & mining
overall (87.7%; 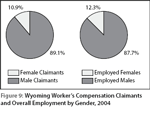 see Figure 9). Female
claimants’ average annual wages in mining differed less than male claimants’
wages than the wages for male and female claimants overall (Figure
10).
Women in mining earned about $4,300 less than men in the industry, compared
to approximately $10,000 for all female
 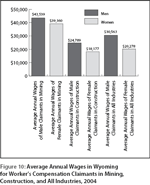 claimants. Earnings differences
between male and female claimants were also narrower than for all those
employed in the industry. In 2004, females employed in natural resources & mining earned $18,417 less annually
than males compared to a difference of $4,300 for claimants.
Approximately 300 more employees working for Workers’ Compensation covered employers in construction filed claims than in the mining industry (see Figure 10). A total of 1,652 males made workers’ compensation claims. The proportion of male claimants employed in construction was similar to the proportion employed in the industry overall (89.1% of claimants compared to 88.6% in the industry overall). Claims were filed by 448 men age 25-34, the largest number by gender and age group.
 The average annual wage in 2004 for all construction
employees was $19,851.
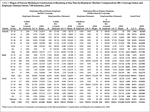 Construction
industry claimants’ wages were about $3,000 less than for all employees
in construction and nearly 50%lower than claimants in the miningindustry
(see Tables
8 and 9). The wages of female claimants
were $1,674 less than for construction employees overall. Conversely,
male claimants’wages were $4,938 greater than for the average annual
wage in construction.
Discussion
Employee turnover is related to opportunities in the labor market. The more the economy is expanding the greater the likelihood that workers will engage in job changing (Mott, 2000; Economic Trends, 1998). Additionally, shorter tenure tends to be associated with workers who are younger or have less education or skills (Economic Trends, 1998). Lower skilled jobs are also usually more physical in nature and consequently present more risk of injury (Capell, 1995).
Lower employee tenure is also linked to increased frequency of accidents. A study of logging injuries in Louisiana (1999) found that most accidents happen to workers with less than three years of experience with their employer. A 1998 study of employees of an Indiana copper plant by Rinefort and Van Fleet found that workers were more frequently injured during the first three to five months of employment.
Tenure and employee age are strongly correlated. Nationally 49.6% of workers 20-24 years of age had worked for their current employer 12 months or less. For employees 45-54 years old the percentage with this level of tenure was only 11.0%. (U.S. Department of Labor, Bureau of Labor Statistics, 2004).
In addition, 2004 Wyoming Workers’ Compensation claims data indicates that younger workers are more likely than their older colleagues to file a claim for workers’ compensation. Wyoming’s higher-than-average incidence of claims in the construction industry is most likely a reflection of the fact that the industry has a high turnover rate and that workers are younger than the statewide average. Nationwide, construction and extraction occupations constituted 6.0% of employment but accounted for 11.4% of nonfatal occupational injuries and illnesses with days away from work (U.S. Department of Labor, Bureau of Labor Statistics, 2005). Wyoming increasingly relies on a nonresident labor force (Jones, 2006). As demonstrated by the relatively large number of workers without known demographic characteristics, the construction industry depends on workers who have limited attachment to the state.
Classical economic theory suggests that workers employed in hazardous jobs will tend to earn higher wages in exchange for risk (Smith, 1776/1937). While occupations in mining and construction typically pay higher than average wages, there is a risk for working in these industries. Additionally, younger workers face the prospect of greater lifetime earnings losses when injured on the job compared to older workers (Viscusi, 1993).
Research Extensions
This study represents an important step in understanding the characteristics of workers and their injuries in mining and construction in Wyoming and other western states. Since younger employees are more frequently injured on the job than older workers, one extension could be to examine whether the rate of work-related injury decreases as the overall age of the work force increases. It also may expose differences in the types of injuries that occur to older workers, thus revealing potential targets for prevention activities. Another expansion of this research might address how injury characteristics change in the face of rapid economic expansion. In 2004, Wyoming’s economy was exiting a period of steady growth and entering a period of rapid economic expansion. Because low tenure has been linked to higher rates of injury, alternative prevention strategies may be necessary when employee tenure is relatively short. Additionally, Wyoming’s economy has increasingly come to rely on workers without known demographic characteristics, suggesting that they are most likely nonresidents. Replication of the study on other years of Workers’ Compensation data would help to determine to what degree, if any, these missing characteristics limit generalization of the results to other years. Last, a study of nonresidents who are injured may indicate characteristics unique to these employees and help target injury prevention actions.
Summary
The physical nature of many of Wyoming’s jobs makes them inherently risky. However, prevention efforts by both employers and employees could mitigate the risks. A number of factors contribute to the risk level such as the employee’s education, age, and tenure with an employer. Because 2004 was a year of transition from steady growth to rapid expansion, it is unclear whether the results found using the data from 2004 will be useful in generalizing to other years, particularly the years of rapid economic expansion, and for studying the increasing number of workers with limited attachment to the state.
References
Bleizeffer, D. (2006, August 6). Pipeline construction brings hundreds to southern Wyoming. Casper Star-Tribune. Retrieved February 10, 2009, from http://tinyurl.com/o2z3sl
Capell, P. (1995, August). Nerds get best jobs – tough guys finish last. American Demographics. Retrieved February 13, 2009, from http://tinyurl.com/on7gfb
Chelius, J.R. (1991, September). Role of workers’ compensation in developing safer workplaces. Monthly Labor Review. U.S. Department of Labor, Bureau of Labor Statistics.
Economic Trends. (1998, October). Job tenure. Economic Trends. Retrieved February 12, 2009, from http://tinyurl.com/puj6tj
Jones, S. (n.d.). Earnings by Age, Gender & Industry. Retrieved February 9, 2009, from http://doe.state.wy.us/lmi/wfdemog/toc3.htm
Jones, S.D. (2006, April). States of origin for Wyoming workers. Wyoming Labor Force Trends. Retrieved March 3, 2009, from http://doe.state.wy.us/lmi/0406/a1.htm
Leonard, D. (2006, January). Using turnover statistics to reveal underlying labor market trends. Wyoming Labor Force Trends. Retrieved February 11, 2009, from http://doe.state.wy.us/LMI/0106/a1.html
Lukasiewicz, J. and Tschetter, J. (1983, March). Employment changes in construction: secular, cyclical, and seasonal. Monthly Labor Review. Retrieved February 11, 2009, from http://www.bls.gov/opub/mlr/1983/03/art2full.pdf
Mott, D.A. (2000, October). Pharmacist job turnover, length of service, and reasons for leaving, 1983-1997 [Abstract]. American Journal of Health-System Pharmacy. Retrieved February 12, 2009, from http://www.medscape.com/viewarticle/406884-1
National Academy of Social Insurance. (2008, August). Workers’ Compensation: Benefits, Coverage, and Costs, 2006. Retrieved April 7, 2009, from http://tinyurl.com/pwhy6f
Rinefort, F.C., and Van Fleet, D.D. (1998, June). Work injuries and employee turnover. American Business Review. Retrieved February 12, 2009, from http://tinyurl.com/r2lmtr
Smith, A. (1776/1937). The Wealth of Nations. New York: Modern Library. In Viscusi, W.K. (1993, December). The value of risks to life and health. Journal of Economic Literature, 31, 1912-1946.
Smith, S., de Hoop, C., Marx, B., and Pine, J. (1999, March). Logging injuries in Louisiana: nature, trends, and rehabilitation considerations. Work. Retrieved February 12, 2009, from http://tinyurl.com/pducks
U.S. Department of Labor, Bureau of Labor Statistics. (n.d.). Table 1. Incidence rates of nonfatal occupational injuries and illnesses by selected industries and case types, Wyoming, 2004. Retrieved February 10, 2009, from http://doe.state.wy.us/lmi/OSH/OSH_04/t1.htm
U.S. Department of Labor, Bureau of Labor Statistics. (2004, September 21). Employee tenure in 2004. News. Retrieved February 13, 2009, from http://www.census.gov/compendia/statab/2006/labor_force_employment_earnings/
U.S. Department of Labor, Bureau of Labor Statistics. (2005, November). Employment and Nonfatal Occupational Injuries and Illnesses With Days Away from Work, by Occupation Group, 2004. Retrieved February 13, 2009, from http://www.bls.gov/iif/oshwc/osh/os/osbl0021.pdf
U.S. Department of Labor, Bureau of Labor Statistics. (2007, December 7). 2006-16 national employment matrix, detailed occupation by industry. Employment Projections. Retrieved February 13, 2009, from http://www.bls.gov/emp/empoils.htm
Viscusi, W.K. (1993, December). The value of risks to life and health. Journal of Economic Literature, 31, 1912-1946.
Wyoming Worker’s Compensation Act, 27 Wyo. Stat. Ann. §§ 14-102 and 14-108 (1986).
