Chapter 5: Examining Intent to Leave Employment
by: Douglas W. Leonard, Senior Economist
Introduction
This chapter details the efforts of Research & Planning (R&P) to predict respondent answers to survey question 31, “Do you plan to leave employment with your department within the next 12 months?” Doing so allows us to identify the characteristics associated with a “yes” response to the question. In addition, modeling may indicate future management actions to reduce the risk of employee separations. In this chapter, we first describe factor analysis, a procedure used to understand the structure of questionnaire responses. We then use factor analysis results in addition to other questionnaire variables to model responses to question 31 in a binary logistic regression analysis. The modeling process allows us to estimate increases or decreases in risk of a “yes” response on question 31 for three Wyoming government agencies (the Department of Employment, the Department of Family Services, and the Department of Workforce Services) combined.
Methodology
 Although respondents returned 971 questionnaires (see Chapter 2), not all questionnaires contain usable responses or were in the scope of correctly predicting responses to question 31. Responses eliminated from the factor analysis or logistic regression modeling had the following characteristics:
- No answer to question 31
- Respondent plans to retire within 12 months
- Respondent previously retired and returned to work
- Respondent no longer working in his or her respective agency
Eliminating records based on the above attributes from the analysis produced a data set with 916 usable responses.
Once we selected the final record set for analysis, we then filled (or imputed) missing responses to the scaled item questions (e.g., 1-5 response). Imputation allowed us to increase the number of usable responses without altering the character of the data set. We did this by basing the imputed values on the median value of those who did answer each question by agency and gender. Imputed median values generally do not bias the average question scores, which would potentially alter analysis results.
Because the received questionnaires were not in the same proportions as the mailed questionnaires (e.g., a greater proportion of males) we weighted the data. Weighting allowed us to make the sample of received questionnaires look like the universe of mailed questionnaires in the analysis. The universe we described in this case is a count of all questionnaires mailed minus retirees, returned retirees, and those not working for their respective agencies as of the reference date by agency and gender. We calculated the weights by dividing the universe counts by the received questionnaire counts by agency and gender. We applied the weights to responses in both the factor analysis and logistic regression analysis.
Results
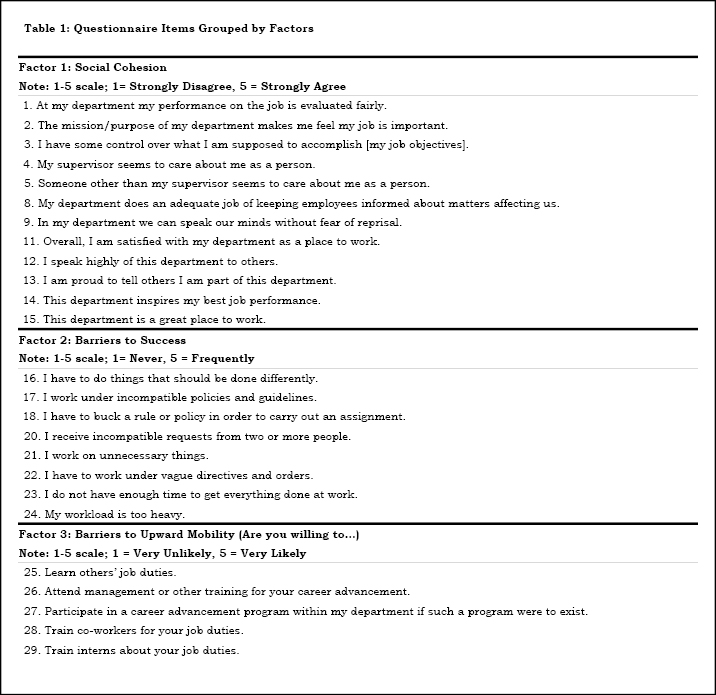
Factor analysis is a statistical technique that shows which scaled item questions are linked to one another. Combinations of scaled item questions added together are called common factors. Complete details of the factor analysis can be reviewed online at http://doe.state.wy.us/LMI/SPR_08/appD.htm. The factor analysis revealed three factors or constructs in the scaled item questions shown in Table 1 (Hatcher).
The first factor shown in Table 1 is social cohesion. We define social cohesion as the degree to which shared experiences, culture, and beliefs bind individuals together in groups. Theoretically, more cohesive groups work more efficiently and accomplish more than less cohesive groups. In addition, cohesion increases individuals’ motivation to contribute to group welfare, which gives their roles more meaning. The second factor was barriers to success. These items focus on the external limitations placed on workers in their jobs. Generally, the greater the scores on these items, the more dissatisfied and unhappy workers may become. This, in turn may affect workers’ desire to leave their agency or section. The third factor was barriers to upward mobility. These questions deal with worker perceptions of training and advancement opportunities in their jobs. Workers who perceive barriers to advancement might become more frustrated in their jobs and consequently be more likely to quit.
With the factor structure defined, we then combine (add) the scores of the individual items to obtain a factor score for each survey respondent. The factor scores, in addition to other questionnaire items, were used to predict respondent answers to question 31, “Do you plan to leave employment with your department within the next 12 months?”
The purpose of survey research was to predict respondent behavior based on respondent answers and characteristics. In this case, the dependent variable in our model was question 31, which had two possible outcomes, “yes” or “no.” Binary logistic regression allowed us to estimate the probability of the answer given based on factor scores and respondent-specific characteristics. Table 2 shows the results of the regression model. The number of responses contained in the logistic model was 904, because 12 cases were statistical outliers.
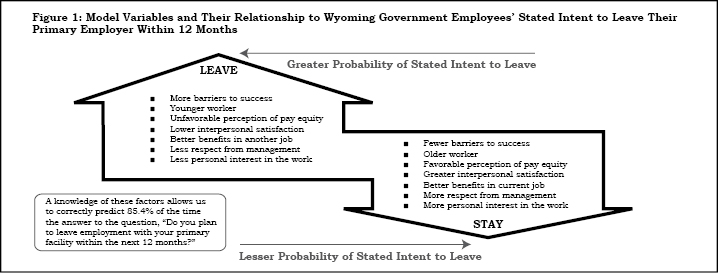
One of the main features of the model was to predict the change in odds of a certain type of response for a given set of conditions. The odds ratios in Table 2 quantify the increase or decrease in risk of a “yes” response on question 31 based on respondent factor scores and demographic information. For every point the barriers to success score increases, the odds of intent to leave increases by 10.6% (1.106-1). Similar odds-increasing results were observed for workers who would take a different job if they could get more respect from management (+58.4%) and if the new job was more interesting to them personally (+145.0%). The odds of intent to leave was lowered as people aged (-6.8% each year older), as their social cohesion perceptions increased (-6.5% for each point of increase), as perceptions of external pay equity increased (-25.5% for each point of increase), or if another employer was perceived to have better benefits (-63.1%). Figure 1 (see page 30) shows the relationship of each of the model variables to the increase or decrease in the odds of stated intent to leave.
Discussion
Once we identified variables with a significant relationship to intent to leave, we then identified which items and to what extent management could influence them. For example, respondent age changes naturally, but social cohesion and barriers to job success can improve through modified management philosophies, better communication, and procedural changes. Increasing employees’ personal interest in their current jobs might be accomplished through mentoring, job sharing, or job rotation. The risk associated with external pay equity is not under the control of management. However, the consultant hired to review the state’s pay system should be able to quantify and address this issue (Wyoming Department of Administration & Information, Human Resources Division).
Conclusion and Future Research
The factor and regression analysis illustrated patterns in respondent answers in addition to providing management direction for reducing the risk of employee separations in three state agencies. Several risk factors were significantly related to respondents’ stated intent to leave employment. However, not all items are controllable at the supervisory or executive director level. Managers should consider both potential positive and negative outcomes, particularly unintended negative outcomes, when taking action.
The results for all three agencies combined could be considerably different when analyzing them individually. Different factor structures and model results could reveal cultural and procedural traits of departments that may provide a basis for more specific management actions. More detailed department-level results could be developed separately for each agency at a later date.
References
Hatcher, L. (1994). A step-by-step approach to using SAS for factor analysis and structural equation modeling. Cary, NC: SAS Institute, Inc.
Wyoming Department of Administration & Information, Human Resources Division. (2008). State of Wyoming Job Evaluation, Classification, & Market Pay Project. Retrieved July 29, 2008 from http://personnel.state.wy.us/hrproject/index.htm