Chapter 8: Intentions to Work After Retirement
by: Lisa L. Knapp, Research Analyst
As discussed in Chapter 3, a quarter of all state employees are currently age 55 or older. This proportion is even greater in some departments, such as the Department of Employment (DOE) in which one in three employees is older than age 55 and in the Department of Workforce Services (DWS) in which nearly 40% of employees are in this age group. This is a sizeable number of employees who could potentially retire from the state in the next 5 to 10 years, taking with them years of knowledge and experience.
Part of the purpose of succession planning is to identify the conditions that could possibly influence the decision of these employees to return to work for the state following retirement. This is particularly important because many of those who say they are going to retire generally do so within the time frame indicated. The following sections will cover future retirement plans as well as these conditions in detail based on state agency and age group.
Future Retirement Plans
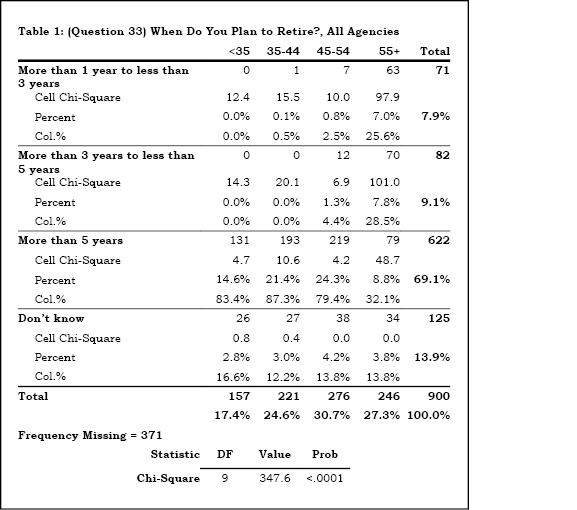
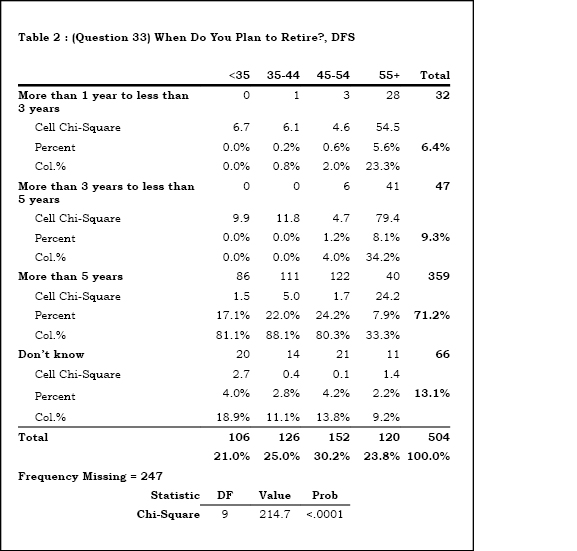
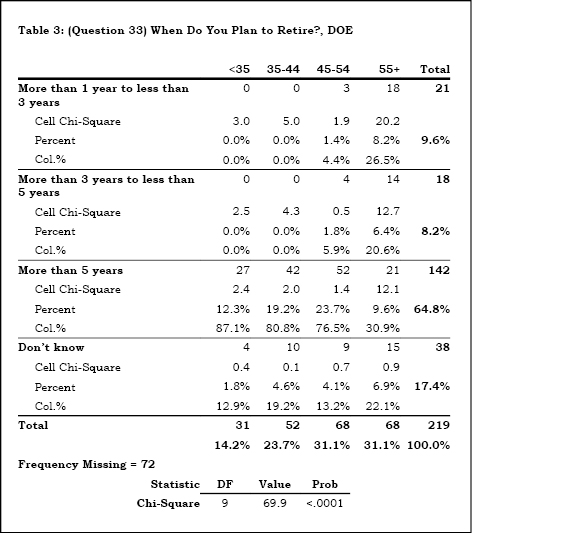
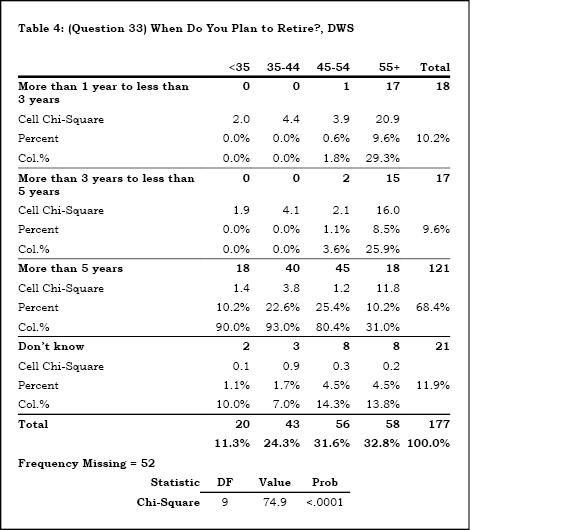
Respondents were asked when they plan to retire. Although the majority of employees in all agencies combined indicated they plan to retire in more than five years (69.1%; see Table 1), more than half of those age 55 or older (54.1%) said they plan to retire in the next one to five years. This was similar for each of the three agencies. In each case the majority of respondents stated they plan to retire in more than five years, but 57.5% of Department of Family Services (DFS) employees age 55 or older, 47.1% of those in DOE, and 55.2% of those in DWS plan to retire in less than five years (see Tables 2, 3, and 4). A chi-square analysis confirmed that these results were all statistically significant (see Chapter 4 for a definition of chi-square and statistical significance).
By Agency
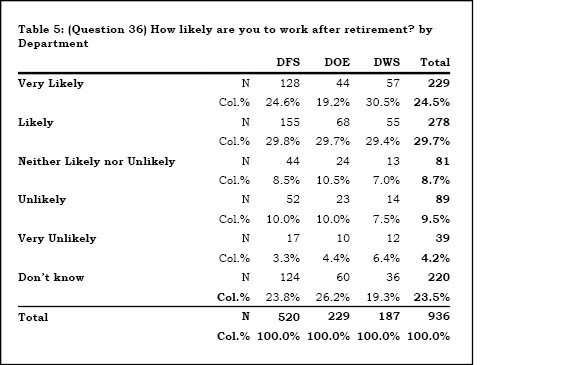
More than half (54.2%) of all employees said they would be likely or very likely to work after retirement (see Table 5). Although a majority of employees in each agency indicated they would be likely or very likely to work after retirement, a greater proportion of DOE employees indicated they were neutral about working after retirement (10.5%) than did employees in DFS (8.5%) and DWS (7.0%). A greater percentage of DWS employees said it was very unlikely they would work after retirement (6.4%) than did employees in DOE (4.4%) or DFS (3.3%).
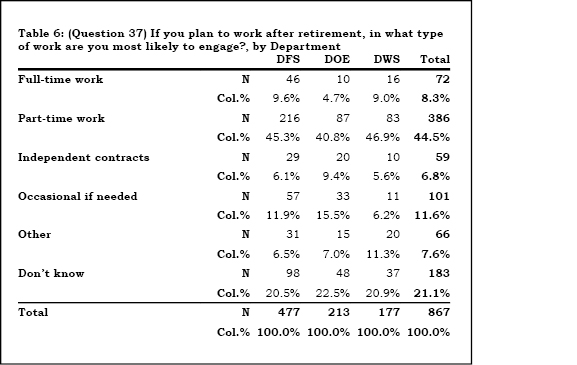
Nearly half of employees (44.5%) said they would be most likely to return to work in a part-time position after retirement (see Table 6). This was particularly true for DFS (45.3%) and DWS (46.9%). A greater proportion of DOE employees stated they would be willing to return to work occasionally as needed (15.5%).
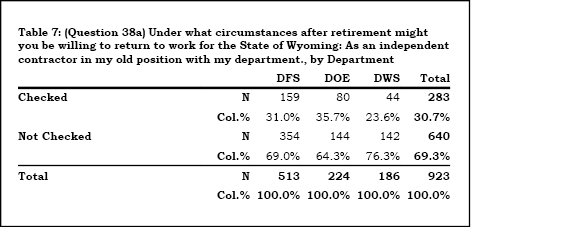
Respondents were given a series of statements to choose from regarding their interest in returning to work for the State of Wyoming after retirement. They were allowed to choose as many statements as they wanted. The first of these statements was “I would be willing to return to work for the State of Wyoming as an independent contractor in my old position with my department.” Overall, 30.7% of responding employees chose this option (see Table 7). A greater proportion of DOE employees chose this statement (35.7%) than DFS employees (31.0%) or DWS employees (23.6%).
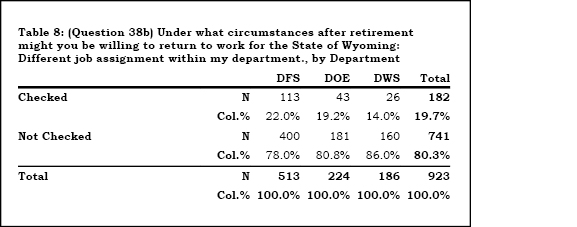
The second statement presented to respondents was, “I would be willing to return to work for the State of Wyoming in a different job assignment within my department.” In total, 19.7% of respondents marked this statement (see Table 8). A greater percentage of DFS employees chose this option (22.0%) than did DOE employees (19.2%) or DWS respondents (14.0%).
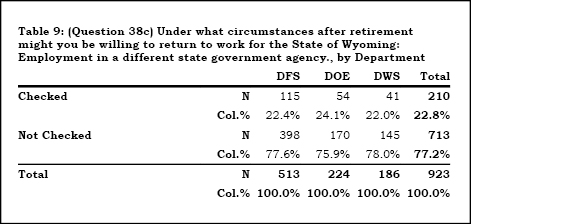
The third option was “I would be willing to return to work for the State of Wyoming as an employee in a different state government agency.” This statement was selected by 22.8% of all employees. Nearly one-quarter of DOE employees (24.1%), 22.4% of DFS employees, and 22.0% of DWS employees expressed interest in this option (see Table 9).
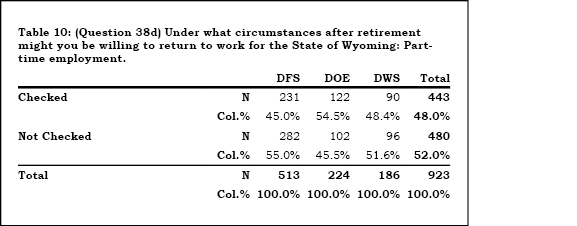
Participants were offered a fourth statement, “I would be willing to return to work for the State of Wyoming for part-time employment.” This was by far the most popular option with nearly half of all employees choosing it (48.0%; see Table 10). In DOE 54.5% of respondents chose this option compared to 45.0% of DFS employees and 48.4% of DWS employees.
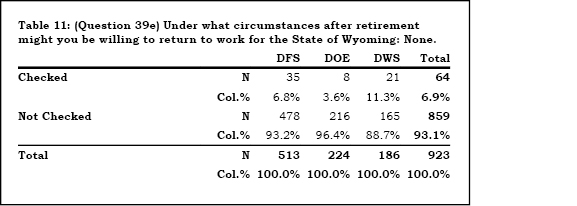
Respondents were also given the choice of none, other, or don’t know. Only 6.9% of respondents chose none of the above (see Table 11). However, a greater proportion of DWS employees chose this option (11.3%) than did those in DFS (6.8%) or DOE (3.6%). Overall, 4.7% of all employees chose other (see Table 12). Examples of other might entail include a desire for more flexible work schedules, better management, and less stress. One-quarter (25.0%) of all employees chose don’t know category (see Table 13). A somewhat greater proportion of employees in DFS (27.0%) chose this option than did those in DOE (21.0%) or DWS (24.2%).
By Age Group
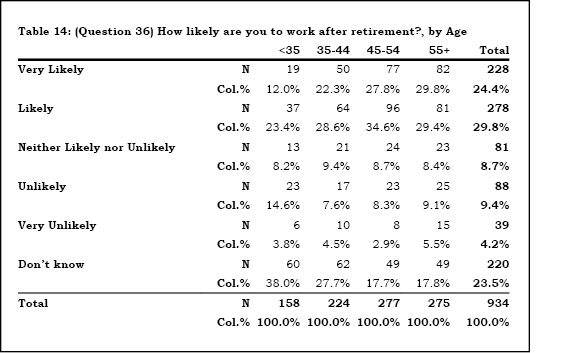
Overall, 54.2% of all employees indicated it was likely that they would work after retirement (see Table 14). The greatest proportion of employees who chose this response were age 45 or older. Nearly two-thirds (62.4%) of those between the ages of 45 and 54 said they would be likely or very likely to work after retirement, and another 59.2% of those older than age 55 answered this way. In contrast, almost one in five (18.4%) respondents younger than age 35 stated that they would be unlikely or very unlikely to work after retirement, and 38.0% of those in this age group said they did not know if they would work after retirement or not.
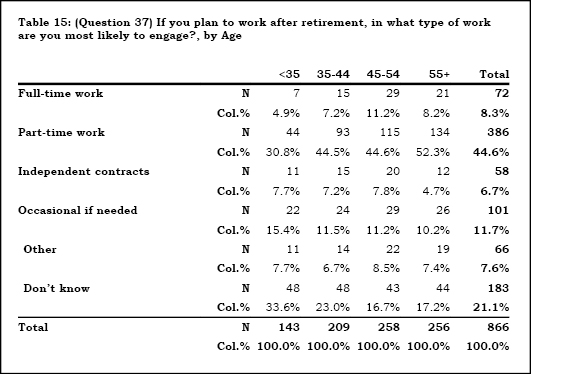
Part-time employment was the most popular response for all employees (44.6%) as well as within each age group (see Table 15). This was particularly true for respondents older than age 55 (52.3%). Younger respondents (age 45 or younger) were more likely to choose don’t know, and a greater proportion of those age 35 or younger marked “occasional if needed” (15.4%) than did the other age groups.
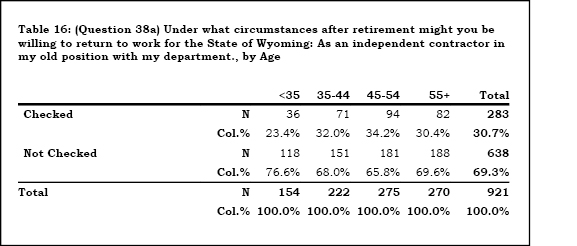
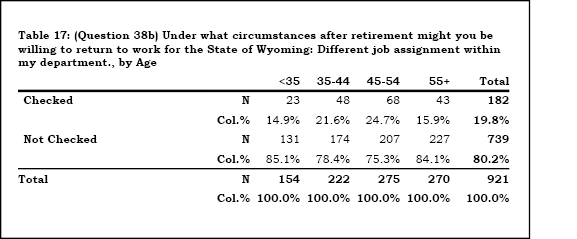
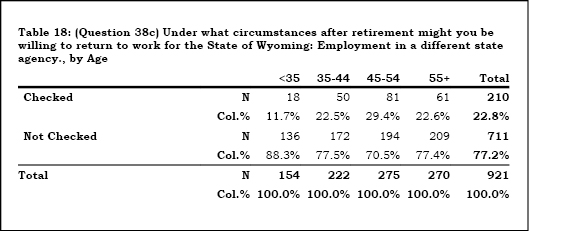
In total, approximately one-third of employees indicated interest in working in their old positions as contractors after retirement (30.7%; see Table 16). This option was least popular with those younger than 35 (23.4%). Another one in five (19.8%; see Table 17) stated they would be interested in working in a different position within their agency after retirement. This option was more popular with those employees in the middle age groups (35-44, 21.6%; 45-54, 24.7%) than with the youngest (14.9%) or oldest (15.9%) respondents. Similarly, nearly one in four employees of all age groups expressed interest in working for another state agency after retirement (22.8%, see Table 18). Again, this option was much less popular among those younger than age 35 than in any of the other age groups (11.7%).
As mentioned earlier, part-time employment within state government was the most often chosen option (see Table 19). Nearly half (48.0%) of employees in all age groups chose this option. This proportion was similar for employees age 35-44 (49.1%), 45-54 (50.9%), and 55 or older (48.9%). However, only 39.6% of respondents younger than age 35 chose this option (see Appendix B to see these tables by agency).
Conclusions
Overall, part-time employment after retirement is the most popular option for employees both by department and by age group. Perhaps departments could create job-sharing positions that could be filled by two or more retirees who work partial days. This may be particularly useful to the three agencies that participated in this study since nearly 50% of respondents indicated they would be interested in returning to their departments either as contractors in their original positions or in a different position.
Another 20% indicated an interest in returning to work for the state in a different agency. Because several positions in DFS, DOE, and DWS are similar, this may present a way for these agencies to work together to provide opportunities for these retirees to use their knowledge in a new position. As Harris (2006) illustrates, there are tools such as O*NET available to identify occupations with skill sets that overlap, which could help to identify which occupations could be considered interchangeable across agencies. Perhaps a job shadowing program could then be put in place in which employees with a particular set of skills in one agency could spend time training with similarly skilled employees of another agency. This could help broaden the pool of employees who could fill a job as well as ease employee transitions between agencies.
References
Harris, M. A. (2006). Tools for identifying critical occupations. Outlook 2010 Revisited: Wyoming’s Labor Market at Mid-Decade (Occasional Paper No.4, pp. 37-46). Casper, WY: Research & Planning. Retrieved September 10, 2008, from: http://doe.state.wy.us/LMI/Occasional/occ4.pdf