Tracking Workers' Re-Employment After Job Loss
This article examines the probability workers will be re-employed following their entry into the UI system (job loss). The statewide claimant re-employment rate for men fell to 57.8% in 2009, compared to 77.2% in 2005. Results also show that during the current economic downturn, men were less likely to be re-employed than women. Non-resident workers were less likely than resident workers to be found working in Wyoming in subsequent quarters following job loss. Workers with greater educational attainment (master's degrees and greater) were less likely to be re-employed should they lose their jobs. However, the data also show that highly educated workers are much less likely to become unemployed than workers with lesser amounts of formal education.
T
he unemployment insurance (UI) system provides partial temporary replacement of income in the event of job loss, supports the search for new jobs, and sustains consumer spending when the economy is contracting (Leonard, 2010). While an understanding of the UI system and its effects on the economy is important, it is also important to track the employment status of unemployed workers after they receive benefits. Re-employment allows workers to more fully support themselves and their families, and enables these workers to re-establish eligibility for UI benefits should another job loss occur.
Recent research (Aaronson et. al, 2010) showed that long periods of unemployment can be more problematic for workers with highly specialized skill sets and reduce the probabilities workers may find new jobs, creating a downward spiral effect: "… in any given month, individuals with longer unemployment spells are less likely to be employed in the following month." The inability to find work also affects a household's ability to meet its debt obligations such as mortgages, automobiles, consumer credit cards, health care expenses, and student loans. As household savings are depleted (if the household has such assets when unemployment begins), choices must be made as to which creditors are paid and which are not.
Methodology
The data used in the current analysis are from the UI claims database (Wyoming Department of Employment, Research & Planning, 2010). We began by extracting an unduplicated list of all claimant social security numbers (SSNs) for each calendar year from 2005 through 2009. Workers were included in the analysis if they filed an initial claim, regardless of their eligibility to receive UI benefits. This group of claim-filers is different from those described by Wen (2010), which only included eligible claimants. Re-employment status was determined by whether those claimants were paid wages from any employer in the first or second quarter of the following year 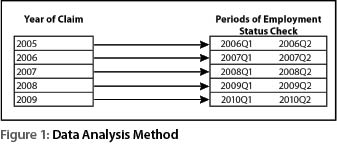 (see Figure 1). If a claimant from the previous year received any wages from a UI covered employer during the first or second quarter of the following year, they were classified as working. We calculated the probability of not working in a UI-covered job as the count of those not working divided by the total number of UI claimants. Claimant characteristics such as age, gender, industry at the time of separation, educational attainment, and physical location when the claim was filed are contained in the UI database.
Results
The figures shown in the report are summaries of statistical tables that can be found here. The tables contain three columns:
• working-same employer
• working-different employer, and
• not working.
The proportions highlighted in the charts are the sum of the two "working" columns.
From 2005 to 2007, the probability of working in a UI-covered job by the 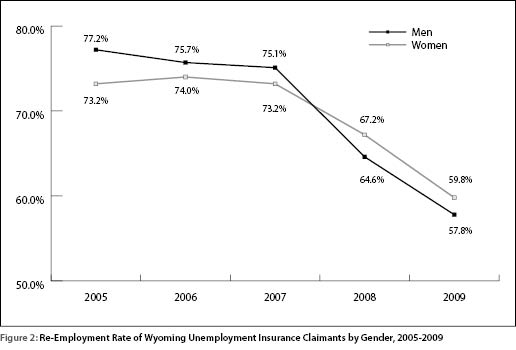 first or second quarter of the following year was greater for men than for women (see Figure 2). Although rates for both genders declined considerably beginning in 2008, the probability of men working in a UI covered job was lower than the rate for women. The probability of men finding a UI covered job after filing a claim declined from 75.1%, in 2007 to 57.8% in 2009.
In 2009, men had a lower probability of finding work than women if they were less than 20 years old (67.7% compared to 67.9%; see Figure 3) or 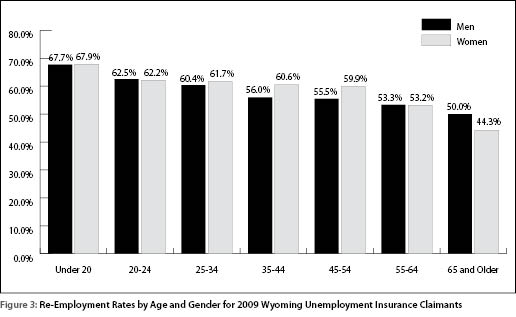 between 25 and 54 years old. Among workers 55 and older, women were less likely than men to be working (e.g., 44.3% for women compared to 50.0% for men 65 and older). The differences in rates of re-employment between men and women were generally greatest during prime earning years (25 to 54). This may in part explain why the gender wage gap decreased in Wyoming (WYDOE, Research & Planning, 2010).
In order to examine re-employment rates by educational attainment, the likelihood of unemployment occurring for workers by education level needs to be determined. Results show that 82.6% of claimants (32,677; see Figure 4) in 2009 had an educational attainment of a high school diploma/GED or less, with the remainder (17.4%) those with greater educational attainment. Therefore, if job retraining is offered, it should be geared primarily to the largest claimant cohort, that being those with high school education or less (see Table 5).
The data in Figure 5 contrasts the distribution of jobs by 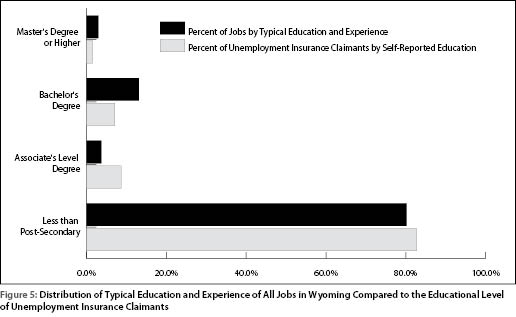 typical education in 2009. The typical education distribution is the combination of the Occupational Employment Statistics program data of employment by occupation and the O*NET data for the typical education by occupation. The percent distribution demonstrates that those with an associate's degree or less are a higher percentage of the unemployed than would be expected from examining the distribution of employment in Wyoming. Figure 5 also shows that a person is less likely to become unemployed as his or her educational attainment reaches the level of a bachelor's degree or higher.
When workers file UI claims, they are asked to state their highest level of educational attainment, so this value is self-reported. Displaced workers in 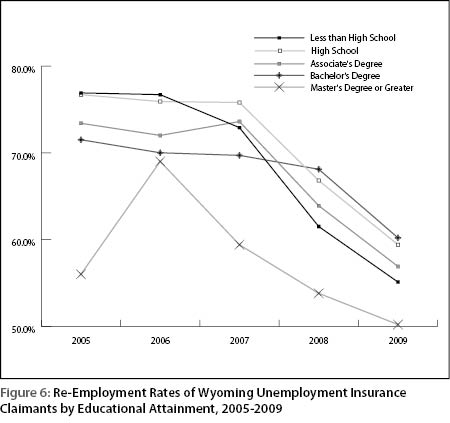 2009 with master's degrees or greater are the least likely to be re-employed (50.0%; see Figure 6), although this cohort is the smallest by educational attainment, and workers in this group are the least likely to become unemployed. The re-employment rate for 2009 claimants with bachelor's degrees was 60.1%. The rates of re-employment declined for all groups beginning in 2008, even though some began declining earlier (less than high school and master's degrees or greater). Prior to the economic downturn, workers with less than a high school education had the greatest probability of re-employment (2006 re-employment rate of 76.7%), but by 2009 their re-employment rate (55.1%) surpassed only workers with master's degrees or greater (50.2%).
When a claim is filed, the UI system captures information regarding the  physical address of claimants that can be used to determine if the claimant is still living in the state. In 2005, the re-employment rate for workers with Wyoming addresses was 79.7% compared to 41.0% for those with out of state addresses (see Figure 7). By 2009, the Wyoming address re-employment rate fell to 66.0% while the re-employment rate of individuals with an out-of-state address declined to 26.1%. The differences in rates are indicative of how workers establish themselves in the state once they have work. Those whose attachments to the state are more tentative are less likely to return to work in Wyoming should a job separation occur.
Information about claimants' employment history, also captured by the UI 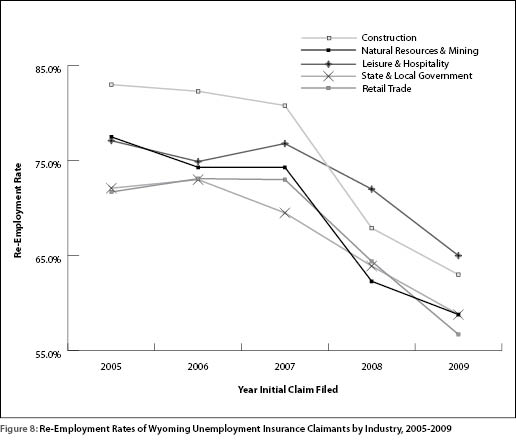 system, allows analysis of re-employment rates by industry. Prior to the economic downturn, construction claimants were among the most likely unemployed workers to be re-employed (83.0% in 2005, 80.8% in 2007; see Figure 8). However, this changed in 2008-2009, when re-employment rates for construction workers fell rapidly to 67.9% and 63.0%, respectively. An almost identical pattern of decline was found in natural resources & mining.
Discussion
Some re-employment rates in Wyoming may have been early indicators of the economic downturn. For example, the rates for those with less than a high school diploma and those with master's degrees appeared to decline earlier than those with other levels of educational attainment (see Figure 6). Additionally, the re-employment rate of displaced workers with out-of-state addresses began its decline earlier than for claimants with Wyoming addresses (see Figure 7). As a final example, the re-employment rate for state & local government and construction workers began to decline earlier than for the other industries shown (see Figure 8). If further investigation proves the validity of these variables as early indicators of a downturn, they may also be used as early predictors of expansion as well.
The differences between resident and nonresident claimants further demonstrate the way in which Wyoming's labor market operates. During times of expansion, the state first exhausts its local labor supply, then imports the labor it needs. During downturns or contractions, the imported labor that arrived during the expansion is generally the first group to be negatively impacted. Such an effect can be seen in the Commuting Pattern Data Model (Leonard, 2010). These data show a rapid increase of workers with out-of-state drivers' licenses during expansion periods and a rapid decline in numbers of the same workers during contraction periods.
Conclusion
While aggregate rates provide general information, the wealth of demographic data available in the UI system can reveal patterns that might otherwise go unnoticed. Re-employment rates for displaced workers are not equal. Factors such as age, gender, educational attainment, and residency status are all related to claimants' ability to regain employment. Currently, Wyoming UI claimants can receive a maximum of 73 weeks of benefits (WYDOE, 2010). Under current state and federal law, all extended benefits expire on April 30, 2011. If workers exhaust all their benefits and are unable to re-establish employment for a sufficient amount of time, they have no safety net should another separation occur. This not only negatively affects the displaced workers but also the businesses and individuals in other areas of the economy that depend upon their economic activity.
References
Aaronson D., Bhashkar, M., and Schechter, S. (2010). What is behind the rise in long-term unemployment. Economic Perspectives (Second Quarter, 2010). Chicago Bank of the Federal Reserve. Retrieved October 26, 2010 from http://www.chicagofed.org/digital_assets/publications/
economic_perspectives/2010/
2qtr2010_part1_aaronson_mazumder_schechter.pdf
Leonard, D. (2010). Estimating the impact of Unemployment Insurance benefit payments on Wyoming's economy. Wyoming Labor Force Trends 47(8). Retrieved October 21, 2010 from http://doe.state.wy.us/LMI/0810/a1.htm
Leonard, D. (2010). Interstate Commuting Inflow: Table 24: Wyoming (Statewide) Inflow by State of Origin for Workers Without a Wyoming or Colorado Driver's License, 2004Q1-2009Q4. Retrieved October 21, 2010, from http://doe.state.wy.us/LMI/commute/
commute2010/pdfs/flow/interstate/inflow/_all_counties.pdf
Wen, S. (2010). Wyoming unemployment insurance benefit payments reach record high in 2009. Wyoming Labor Force Trends 47(2). Retrieved October 27, 2010, from http://doe.state.wy.us/LMI/0210/a1.htm
Wyoming Department of Employment (2010). Emergency Unemployment Compensation. Retrieved October 22, 2010, from http://doe.wyo.gov/workers/unemployment/Pages/
EmergencyUnemploymentCompensation.aspx
Wyoming Department of Employment Research & Planning. (2010). Earnings in Wyoming, 1992-2009 by County, Industry, Age, & Gender. Retrieved October 21, 2010, from http://doe.state.wy.us/LMI/earnings_tables/
2010/index.htm#statewide
Wyoming Department of Employment, Research & Planning. (2010). Unemployment insurance claims database. Unpublished data.