Wyoming Unemployment Insurance Benefit Payments Reach Record High in 2009
Large layoffs occurred in all industries and counties in Wyoming in 2009, with the mining industry and mining-dominated counties most heavily affected. Men were laid off more frequently than women, and younger male workers were hit especially hard by the economic downturn.
As the national recession entered its second year in 2009, Wyoming also experienced a significant downturn in all industry sectors. The state unemployment rate rose to 7.5% by December 2009, more than double the December 2008 rate of 3.4%. A total of 37,312 individuals lost jobs in Wyoming (U.S. Department of Labor, 2010) and collected unemployment insurance during the year, the highest level since 1997 (when comparable records are available). The Wyoming Department of Employment paid more than $161.4 million in Unemployment Insurance (UI) benefits from the state UI trust fund, the highest level since 1982. By the end of 2009, 12,069 individuals exhausted their regular UI benefits and had collected a total of $39.9 million federal Emergency Unemployment Compensation (EUC).
There were a total of 54,460 new UI claims (initial claims) and 507,461 weeks of benefits claimed (continued claims) in 2009, over-the-year increases of 106.0% and 201.0%, respectively, compared with the levels in 2008 (26,422 new claims and 168,710 weeks claimed). Both initial and 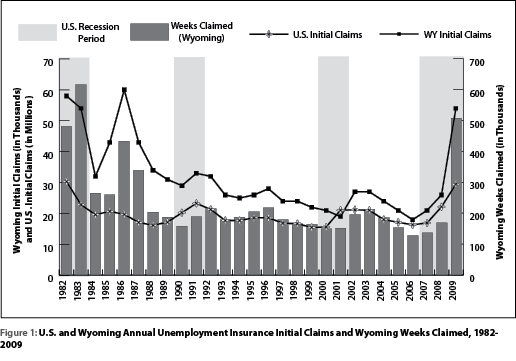 continued claims reached 23-year highs (see Figure 1). New claims reflect individuals who were laid off. An individual could have more than one new claim if he or she was laid off more than once during the year. As shown in Figure 1, Wyoming initial claims lagged behind the U.S. by approximately one year in terms of large layoffs. With respect to larger layoffs, the last recession was also shorter for Wyoming than the U.S. (two years compared to three years). Whether Wyoming outperforms the U.S. economy during the current recession likely will depend on natural resources markets such as oil and gas and coal because of the state’s strong relationship to energy-related commodities.
This article focuses on individual persons who received UI benefits in the year and provides a detailed demographic analysis of these unemployed workers. The characteristics discussed include state of residence, pre-layoff industry, age, and education level. This information may help employers and work force development agencies find and identify potential labor sources.
Discussion
UI Recipients and Exhaustees
In 2009, there were 37,312 individuals who lost jobs in Wyoming and collected UI benefits (UI recipients; see Figure 2),the highest during the 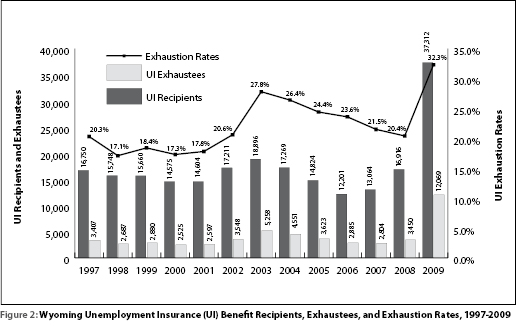 period dating back to 1997. Nearly one-third (12,069) had exhausted their regular benefits by the end of the year. The exhaustion rate (exhaustees divided by the number of UI recipients) of 32.3% was also the highest in the past 13 years.
Industry Changes
Every industry experienced at least double-digit percentage increases in UI recipients from 2008 to 2009 (see Table 1); half of the industries 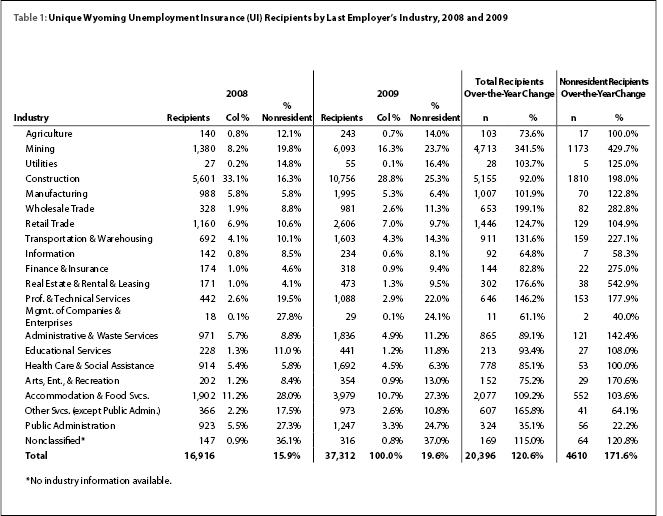 sustained triple-digit increases. Mining had the largest over-the-year percentage increase in UI recipients (341.5%) from 1,380 workers in 2008 to 6,093 workers in 2009 who lost jobs. Wholesale trade and real estate and rental & leasing followed mining with increases of 199.1% and 176.6%, respectively. The largest share of UI recipients was in construction in both 2008 (33.1%, or 5,601) and 2009 (28.8%, or 10,756). Mining was second, with 16.3% of total UI recipients in 2009, followed by accommodation & food services with 10.7%.
Approximately one-fifth (19.6% or 7,297) of total UI recipients in 2009 were non-Wyoming residents, up from 15.9% in 2008 (see Table 2). 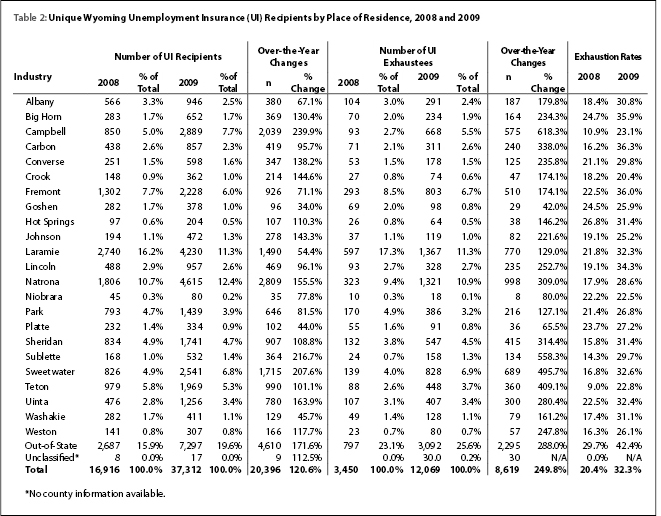 The majority (72.0%) worked in one of three industries before becoming unemployed: construction (37.3%), mining (19.8%), and accommodation & food services (14.9%; see Figure 3). This finding is consistent with previous research on the Wyoming work force (Jones 2009). During the economic expansion prior to 2009, many nonresidents worked in Wyoming.
 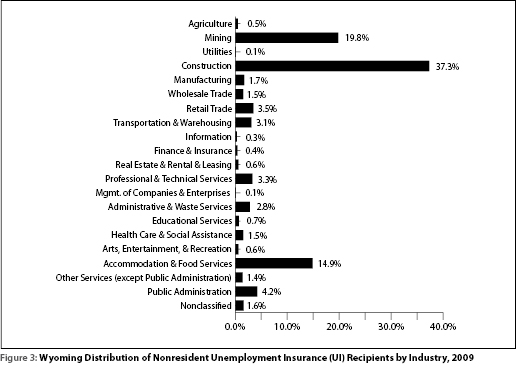 Consequently all industries contributed to the number of nonresident UI recipients. Nearly one-fourth (24.1%) of the 29 UI recipients from management of companies & enterprises were out-of-state residents. Health care & social assistance and manufacturing had the lowest percentages of nonresident UI recipients (6.3% and 6.4%, respectively).
County Distribution
According to the research by Leonard (2009), many individuals commute from their county of residence to one or more counties to work in Wyoming. However, in order to help identify the labor supply in each county, this research is based on place of residence rather than place of work.
Natrona and Laramie counties were the most populous Wyoming counties with the largest employment. According to the Wyoming Quarterly Census of Employment and Wages for second quarter 2009, Natrona County accounted for 13.9% of employment while Laramie County accounted for 15.6%. Consequently, these counties had the most UI recipients in both 2008 and 2009. In 2008, a total of 2,740 recipients were from Laramie County (16.2%), while 1,806 resided in Natrona County (10.7%). By 2009, the number of Natrona County recipients more than doubled, rising to 4,615. In contrast, the percent of Laramie County UI recipients rose by 54.4% (1,490) from 2008 to 2009 to 4,230 recipients.
Every county in the state experienced a large downturn in 2009 with double- or triple-digit increases in UI-covered unemployed workers. Counties tied heavily to the mining industry were hit hardest. Campbell County experienced the largest increase in UI-covered unemployed workers (239.9%, or 2,039) compared to the year before. Sublette and Sweetwater counties followed with increases of 216.7% and 207% (364 and 1,715), respectively.
Exhaustion rates reflect the difficulty of finding employment. Exhaustion rates are typically higher during economic downturns and lower during expansions. All Wyoming counties had higher exhaustion rates in 2009 than in 2008. Carbon, Fremont, and Big Horn counties had the highest exhaustion rates in 2009 (36.3%, 36.0%, and 35.9%, respectively). Nonresident UI recipients had the highest exhaustion rate (42.4%) with nearly half (3,092) of them exhausting their regular UI benefits by the end of 2009 (see Table 2). This indicates that they may have more difficulty becoming reemployed following a layoff than those living in Wyoming.
Age and Education Level
More than one-third of UI recipients were 34 years old or younger in both 2008 and 2009 (see Figure 4). 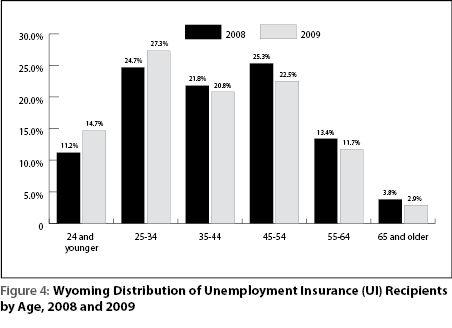 The increase in the number of UI recipients in 2009 was more significant for younger than for older recipients. The percentage of UI recipients age 34 and younger rose from 35.9% of the total in 2008 to 42.0% in 2009.
Men accounted for more than two-thirds of the UI recipients in both years (see Figure 5). Additionally, the proportion of men increased significantly in 2009 for all age groups. 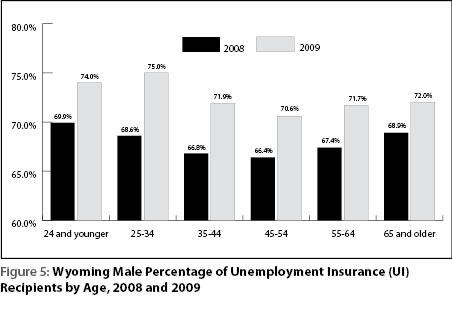 In 2008, 68.6% of UI recipients 25 to 34 years of age were men; in 2009 the proportion was 75.0%.
Among the 37,312 UI-covered unemployed workers in 2009, the majority (59.5%) had only a high school education; one-tenth (10.0%) had less than a high school education, while 8.1% had an associate’s degree and 9.0% had a bachelor’s degree or higher education (see Figure 6). 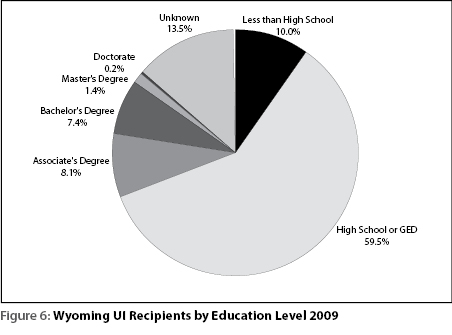 This is consistent with previous research that indicated the vast majority of covered employees have a high school diploma or less, and the majority of jobs only required a high school diploma or less (Wyoming Department of Employment, R&P 2006). Table 3 shows that the downturn in 2009 hit every single level of education hard.
 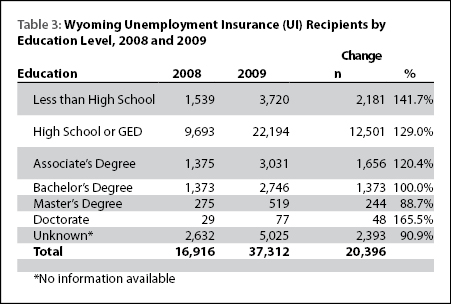 The number of unemployed workers at least doubled for all education levels from 2008 to 2009, with the exception of workers with a master’s degree (88.7% increase). Those with a doctorate had the greatest percentage increase (165.5%), followed by those with less than a high school education (141.7%).
UI Benefit Expenses
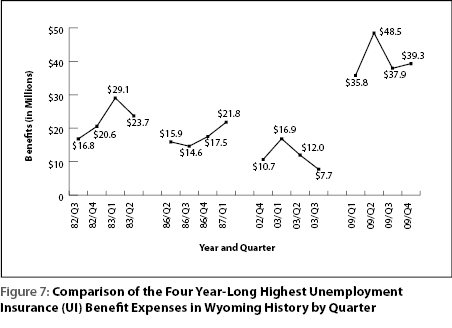
UI benefit expenses reached a record high in 2009. By the end of the year, expenses reached $161.5 million, more than three times the previous year’s expenses ($49.9 million in 2008). In addition, 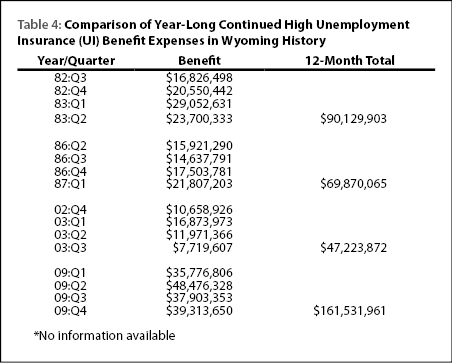 a total of $39.9 million in benefits were paid from the federal EUC program for those who exhausted their regular UI benefits. Table 4 and Figure 7 show the four most difficult 12-month periods of benefit expenses in Wyoming UI history. UI benefit expenses were significantly higher in all four quarters of 2009 compared withthe three other periods of economic downturn.
 There are three primary reasons for the record-high UI benefit expenses in 2009. First there was a large increase in the UI claims level. The weeks claimed for benefits rose by 201.0%, from 168,710 weeks in 2008 to 507,461 weeks in 2009. This large number of claims was last seen in 1983. Second, the maximum and minimum weekly benefit amount increased every year, as did the rising state average wages (Wyoming Employment Security Law, 2007), especially in the past few years when Wyoming’s economy was quickly expanding. From state fiscal year 1994 to 2009, the maximum weekly benefit grew from $220 to $415, an 88.6% increase, while the minimum weekly benefit amount rose by 87.5%, from $16 to $30. More unemployed workers qualified for a higher weekly benefit due to the large increases in wages in recent years. State average wages increased by 11.0% in 2006, 7.1% in 2007, and 5.7% in 2008. Also, more high-paid workers claimed UI benefits in 2009. Mining claimants accounted for 16.3% of total UI recipients in 2009, up from 8.2% in 2008. The average weekly wage for mining workers was $1,344 in second quarter 2009, compared to $768 for workers in all industries (Wyoming Department of Employment, R&P 2010). Figure 8
 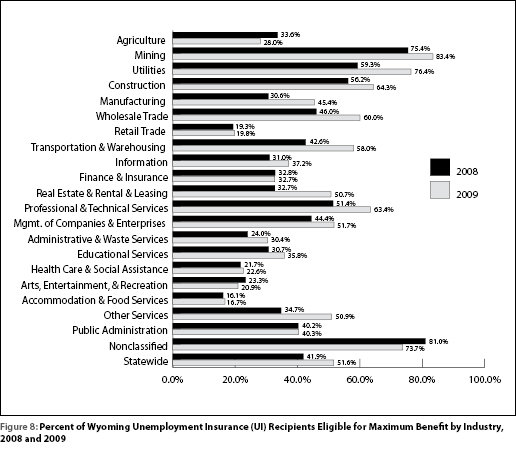 shows how many UI recipients in each industry qualified for maximum UI benefits. In 2009, the majority of UI recipients from mining (83.4%), utilities (76.4%), and construction (64.3%) were eligible for the maximum weekly benefit. These three industries contributed nearly half (45.2%) of total UI recipients in 2009.
By the end of third quarter 2009, the average weekly benefit amount in Wyoming was $346, an increase of 14.6% from the 2008 level ($302; U.S. Department of Labor, Employment and Training Administration, 2010). In 1982, it was only $136.56 (U.S. Department of Labor, Employment and Training Administration, 1996). The average weekly benefit in 2009 was 2.5 times greater than in the 1980s. Consequently, the Wyoming Department of Employment needs to reserve two to three times as much money in its UI trust fund than it did in the 1980s to cover the same number of UI claims.
Trust Fund Situation
After two years of economic recession and high unemployment rates, many states have run out of money in their state UI trust funds and have borrowed federal money to pay their UI claims. As of February 1, 2010, 27 states had borrowed a total of $30.7 billion in federal money (U.S. Department of Labor, Employment & Training Administration, 2010). Two of Wyoming’s neighboring states, Idaho and South Dakota, were among those that took out loans from the federal government. States that borrowed money from the federal government face the difficulty of repaying the loans promptly while rebuilding their own state UI trust funds. Businesses in those states may face years of large UI tax increases for that repayment and rebuilding to occur.
Compared with harder-hit states and the situation Wyoming faced in the early 1980s, Wyoming’s UI trust fund is in much better condition with no immediate solvency issues (see Figure 9). 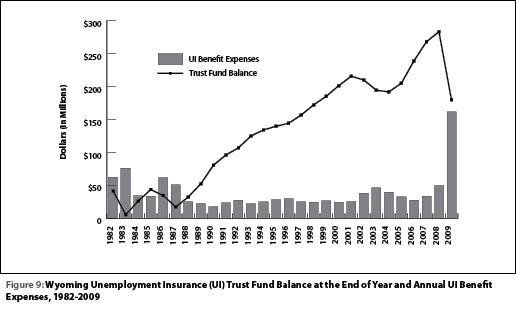 At the end of 2009, Wyoming still had $179.8 million available in the UI Trust Fund to pay UI benefits, down 36.5% (-$103.3 million) from a year ago ($283.1 million). In the scenario that Wyoming’s 2009 UI experience continues into 2010 ($161.5 million UI expenses in 2009), the current state UI trust fund should have sufficient funds for another year. Based upon a projection conducted in January 2010, for the worst case, if 2009’s UI experience continues, the current UI trust fund should be able to last about one and a half to two years, taking into account UI tax collections, the uncreased UI tax rate for 2010, and UI trust fund revenues.
Conclusion
Wyoming experienced record levels of UI benefit expenses, as well as the highest numbers of claimants in decades. Large layoffs occurred in all industries and counties. The mining industry and counties with substantial mining-related employment were most heavily affected. Men were laid off more frequently than women, with men under age 35 hit especially hard by layoffs. Double- or triple-digit increases in UI recipients happened across all education levels. About one-fifth of the UI recipients were out-of-state residents, the majority of whom worked in construction, mining, and accommodation & food services prior to layoffs.
References
Department of Labor, Employment and Training Administration (2010). Trust Fund Loans. Retrieved February 3, 2010, from http://workforcesecurity.doleta.gov/unemploy/budget.asp
Department of Employment, R&P 2010. Quarterly Census of Employment and Earnings. Retrieved February 5, 2010 from http://doe.state.wy.us/LMI/09Q2_QCEW/toc.htm
Jones, S. (2009). Wyoming Workforce Characteristics: Nonresident Influences. Wyoming Workforce Annual Report 2009
Leonard, D. (2009). Commuting in Wyoming 2006Q1-2008Q4. Retrieved February 16, 2010, from http://doe.state.wy.us/LMI/commute09/index.htm
U.S. Department of Labor, Bureau of Labor Statistics. What is the difference between job losers and the unemployed? Retrieved February 23, 2010, from http://www.bls.gov/lau/laufaq.htm#Q9
U.S. Department of Labor, Employment and Training Administration. UI Data Summary. Retrieved February 2, 2010, from http://workforcesecurity.doleta.gov/unemploy/content/data.asp
U.S. Department of Labor, Employment and Training Administration (1996). Unemployment Insurance Financial Handbook 394. Washington, D.C. U.S.
Wyoming Department of Employment, R&P 2006. Outlook 2010 Revisited: Wyoming’s Labor Market at Mid-Decade, May 2006. An in-depth review of Wyoming Labor Market information topics.
Wyoming Department of Employment, R&P 2010. Quarterly Census of Employment and Earnings. Retrieved February 24, 2010 from http://doe.state.wy.us/LMI/09Q2_QCEW/09q2t10a.htm
Wyoming Employment Security Law (27-3-303, page 18), 2007