Dynamics of Unemployment Spells: A Look at the Trends Before, During, and After the Great Recession
(Tables and Figures)
See Related Article
Table 1
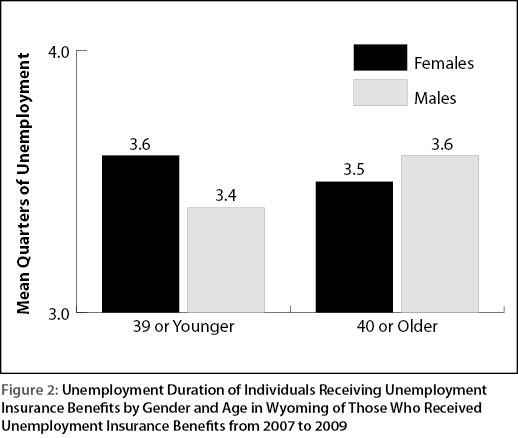
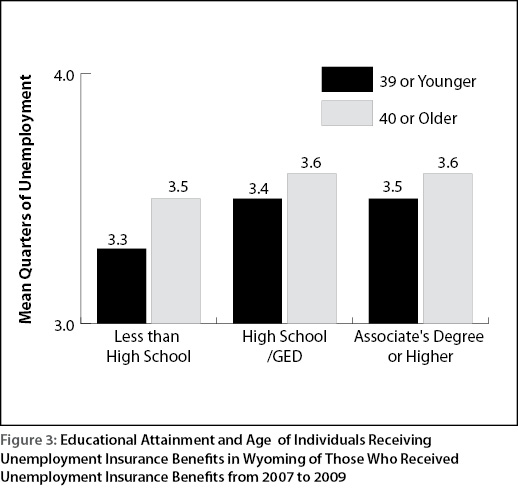
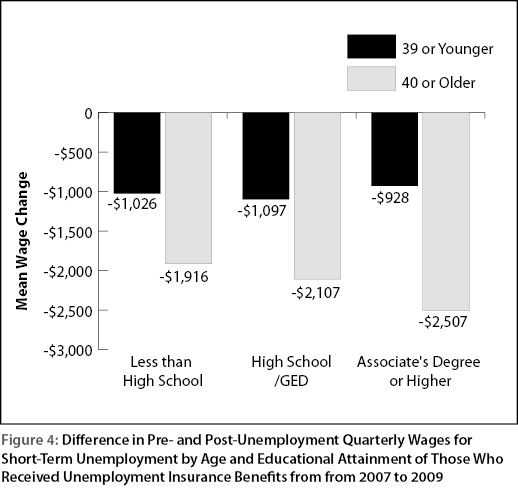
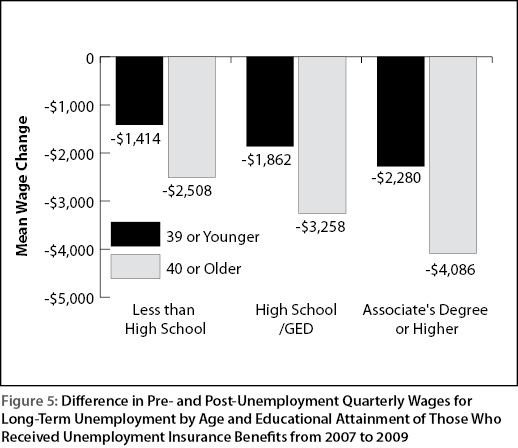
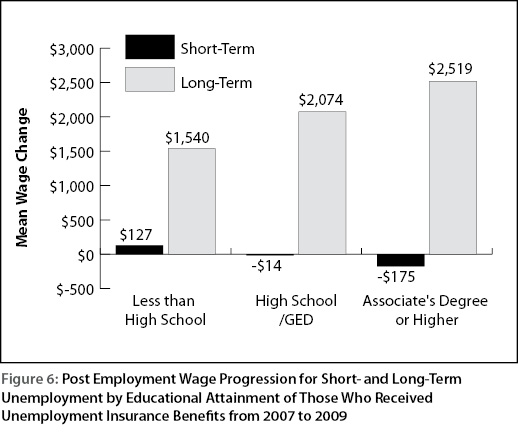
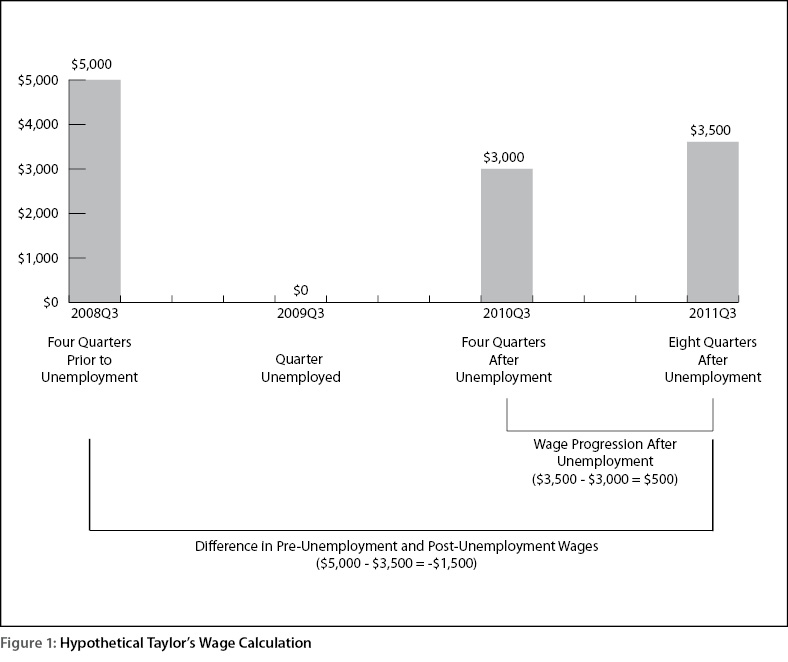
Figures 1, 2, 3, 4, 5, 6
| N | % | |
|---|---|---|
| Gender | ||
| Males | 1,525 | 63.8% |
| Females | 865 | 26.2% |
| Education | ||
| Less than High School | 208 | 8.7% |
| High School Diploma or GED | 1,458 | 61.0% |
| Associate's Degree or Higher | 539 | 22.6% |
| Unknown | 185 | 7.7% |
| Age | ||
| 39 and Younger | 792 | 33.1% |
| 40 and Older | 1,598 | 66.9% |
| Total | 2,390 | 100.0% |