
An Update on Nursing Employment in Wyoming
See Related Tables and Figures
Wyoming’s nursing workforce plays an important role in providing quality health care. As the baby boom generation ages, Wyoming’s health care needs will increase substantially, including the need for services provided by nurses. In order to plan for these future needs, it is important to understand trends in wages, turnover, demographics, and other variables in the nursing workforce.
The ability of Wyoming’s health care system to deliver high quality services to its citizens is of critical importance. A key part of the state’s health care system is its nursing workforce. This article presents a brief overview and update to the previously published nursing dashboard indicators. The tables provide information on trends in nursing wages, demographics, and turnover. Although this research focused on trends in the nursing profession, turnover and earnings analyses for other industries and statewide for comparison purposes are available online.
The enactment of the Health Information Technology for Economic and Clinical Health (HITECH) Act (Title 13) of the American Recovery and Reinvestment Act (ARRA, Public Law 111-5) and the Patient Protection and Affordable Care Act (PPACA, Public Law 111-148) will affect all aspects of health care delivery, including the nursing profession. Timely and regular reporting of these indicators will allow readers to better understand how these pieces of legislation and other factors affect this part of the health care system over time. This research is intended to provide a present-day description of the nursing workforce in addition to an analysis of trends affecting this component of the labor market. This analysis begins with a detailed review of the demographic and wage trends in ambulatory care, then transitions to a comparative analysis of all three health care industries (ambulatory care, hospitals, and long-term care), and ends with a health care-wide view of average wages by county of work. The reports generated in the publication of this article update prior research of the same type performed by Leonard (2008).
Data Sets Used
and Methodology
The first data component used in the analysis was the Wyoming State Board of Nursing (WSBN) licensure files (WSBN, 2011). These files contain information on nurse license status and type, and demographics, plus a unique identifier (social security number), which is joined to other administrative databases in Research & Planning’s (R&P) possession. Other datasets used to construct the reports included the Unemployment Insurance (UI; R&P, 2011) Claims Database, the Workers’ Compensation (WC; R&P, 2011) database, the Wage Records (WR; R&P, 2011) database, and the Quarterly Census of Employment and Wages (QCEW; R&P, 2011) database. The QCEW provides employers’ industry assignments and their ownership codes (private, local, state, and federal government).
Definitions
Active RNs, LPNs, or CNAs- The count of licensed professionals who worked in ambulatory health care services, hospitals, or nursing & residential care facilities.
- Average Wages Continuous Employees
- Gross quarterly average wages paid to each continuously employed licensed professional.
- Both Hire and Exit
- When a person works for an employer during the current quarter, but not during the prior or subsequent quarters.
- CNA
- Certified nursing assistants.
- Continuous Employees
- The number of licensed professionals whose primary industry was ambulatory health care services, hospitals, or nursing & residential care facilities in the current quarter, previous quarter and subsequent quarter.
- Employment
- The average number of people working in an industry during the quarter. Each month, businesses report the total number of workers during the week including the 12th. These numbers are summed and divided by three to calculate employment in the quarter.
- Exit
- An exit occurs when a person worked for an employer during the current quarter, but not during the next quarter.
- Exit Rate Percentage
- The number of licensed professionals whose primary industry was ambulatory health care services, hospitals, or nursing & residential care facilities during the prior quarter and current quarter, but not in the following quarter.
- Hire
- A hire occurs when a person was not working for an employer in the prior quarter but is in the current quarter.
- Industry/Primary Industry
- The industry assignments of nurses' primary employers.
- LPN
- Licensed practical nurses.
- Multiple Jobholders
- The number of licensed professionals paid wages by two or more employers during a quarter.
- N.A.
- Information not available or calculation not applicable.
- N.D. (Not Disclosable)
- If the number of Workers' Compensation claims was fewer than five in a quarter, the result was suppressed for confidentiality reasons.
- North American Industry Classification System (NAICS) Codes
- This report refers to ambulatory health care services (NAICS 621; includes physicians' offices, outpatient surgical centers, and medical labs), hospitals (NAICS 622; includes general medical & surgical hospitals and specialty hospitals), and nursing & residential care facilities (NAICS 623; includes residential mental health & substance abuse facilities and homes for the elderly).
- Primary Employer
- The employer who paid the most wages to a worker in a quarter.
- RN and APRN
- Registered nurses and advanced practice registered nurses.
- Tenure
- The number of consecutive quarters each licensed professional worked for the same primary employer, allowing for three quarter breaks.
- Total Employment
- The count of all workers whose primary industry was ambulatory health care services, hospitals, or nursing & residential care facilities.
- Turnover
- Turnover occurs when workers are not continuously employed (see definition of continuous employees).
- Unemployment Insurance Claimants
- The number of workers filing a claim for Unemployment Insurance benefits each quarter.
- Workers' Compensation Claimants
- The number of workers reporting injuries to Workers' Compensation each quarter.
The licensure data were used to build a time series of the types of licenses nurses held in each calendar quarter. For the purposes of this analysis, R&P used a “once a nurse, always a nurse” methodology. This means that once a worker obtains a nursing license, that worker is counted as a nurse from that point forward. Such a distinction smooths the data from one quarter to the next while preserving overall trends.
Nurses were assigned to industries based on their primary employers’ North American Industry Classification System (NAICS; Census Bureau, 2007) and ownership codes (found in the UI tax system). Businesses in NAICS 621 are classified as ambulatory care services, while those in NAICS 622 are classified as hospitals and those in NAICS 623 are classified as long-term and residential care facilities. Employment data for nurses working in other non-health care industries were not shown in the dashboard output tables.
Nurses were assigned to industries according to their primary employer in WR. A nurse’s primary employer is defined as the employer that paid the most wages to each nurse in a particular quarter. The NAICS code of the primary employer is then assigned to individual nurses. Earnings represent the total wage and salary payments to nurses without regard to the number or types of hours worked, since this information is not available from current administrative databases.
Charts were generated for three nursing categories: registered nurses (RN), licensed practical nurses (LPN), and certified nursing assistants (CNA), although the focus of this article is RNs. The RN category includes Advanced Practice Registered Nurses (APRN) except where otherwise noted. Results tables for the other license categories are posted online.
Results
The first results section of this article focuses on ambulatory care only as a way of describing how readers may use the data as a stand-alone product. The second section provides a comparative analysis of RN and APRN statistics between ambulatory care, hospitals, and long-term care facilities to demonstrate a more in-depth analysis technique. The final section compares nurse wages by county of work.
Detailed Analysis:
Ambulatory Care
 |
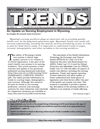
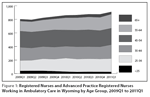
The results for RNs and APRNs working in ambulatory care are shown in Table 1. The number of RNs working in ambulatory care increased from 802 in first quarter 2009 (2009Q1) to 911 in first quarter 2011 (2011Q1), an increase of 13.6%. The addition of RNs was slower from 2009Q1 to 2009Q4. This was concurrent with the economic contraction Wyoming experienced during that time. Examples of how employment levels in the state changed overall and at the industry level, in addition to employment changes in other states, can be found at http://www.bls.gov/ces/ or http://www.bls.gov/cew/. The number of RNs filing either Workers’ Compensation or UI claims during this period was fairly steady.
The average wage amounts and increasing employment demonstrate the resiliency of the health care industry and the nursing profession during the downturn in Wyoming. The wage increase for these nurses between 2009Q4 and 2010Q4 was 1.0% (including bonuses). A similar comparison of 2009Q3 and 2010Q3 reveals a wage increase of 2.9%. For the same two periods, the wage increases for APRNs were 5.6% (fourth quarter) and 6.6% (third quarter), respectively.
Nurses in ambulatory care on average are about two years younger than nurses working in other health care sectors. The average age for RNs in ambulatory care steadily increased between 2009Q1 (44.7) and 2010Q4 (45.9). However, the average age declined slightly to 45.5 in 2011Q1. The age distributions by quarter in the bottom portion of the chart demonstrate how their age demographics changed over time. The age groups that increased the most rapidly were 55-64 and 65+. The 55-64 age group comprised 18.6% of RNs in 2009Q1 and this percentage rose to 22.8% by 2011Q1. The proportion of RNs age 65+ increased from 3.5% in 2009Q1 to 5.1% in 2010Q4, then fell to 3.7% in 2011Q1. The proportions of those between 35 and 44 (24.3% to 22.6%) and 45 and 54 (29.6% to 26.5%) declined between 2009Q1 and 2011Q1. As nurses “age out” and retire, the number of younger nurses available to meet the replacement need appears to be insufficient.
Comparative Analysis
 |
 |
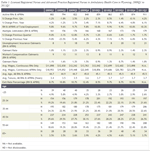
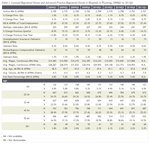
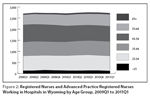
The majority of RNs and APRNs are employed in hospitals (see Table 2). In this industry, they accounted for 27.4% of industry employment during 2011Q1. Of the three health care industries studied, RNs and APRNs working in hospitals earned the most as well. Continuously employed RNs working in hospitals earned $15,845 in 2010Q3 compared to $12,602 in ambulatory care (see Table 1), and $13,910 in long-term care (see Table 3). Previous research by Harris (2007) indicated that although nurses are paid more on average in hospitals, they may seek employment in ambulatory care later in their careers primarily due to work schedules. The more regular hours afforded nurses in ambulatory care, particularly women who have children or want to have children, may make work in this industry more attractive than working in hospitals, where shifts may conflict with family needs. The UI claims rate for RNs and APRNs in hospitals during 2010Q3 (0.6%) was much lower than those seen for RNs and APRNs in ambulatory care (2.3%) and long-term care (4.0%).
 |
 |
 |
Figures 1, 2, and 3 show the age distribution of RNs and APRNs in the three industries. The average age of RNs and APRNs in hospitals remained steady during the eight quarters analyzed, and fluctuated between 47.0 and 47.8. This stands in contrast to long-term care (see Table 3), where the average age of these nurses rose from 44.4 in 2009Q1 to 47.2 in 2011Q1. The greatest concentration of workers younger than 45 during 2011Q1 was in hospitals (53.0%), compared to 46.8% in ambulatory care (see Table 1) and 40.5% in long-term care (see Table 3). Both the number and proportion of RNs and APRNs over the age of 65 increased during the two-year analysis period in all industries. In 2009Q1, this proportion was 4.8% (19; see Table 3) and increased to 7.2% (28) in 2011Q1. Part of the reason the average age of RNs and APRNs increased was that the number working in long-term care fell from 396 in 2009Q1 to 390 in 2011Q1, implying that younger nurses left employment in the industry. A similar increase was observed in hospitals (see Table 2), where the number and proportion of nurses 65 and older increased from 49 (1.8%) in 2009Q1 to 60 (2.2%) in 2011Q1.
Nurses working in hospitals in 2011Q1 had an average tenure of 7.0 years (see Table 2), the highest of the three industries. This was 3.3 years longer than nurses working in ambulatory care (3.7 years; see Table 2) and long-term care (3.7 years; see Table 3). This is consistent with exit rates of RNs and APRNs during 2010Q4. The exit rate for nurses working in hospitals (5.6%) was considerably lower than those seen in ambulatory care (10.9%) and long-term care (13.3%).
Wages by Work Status and County of Work
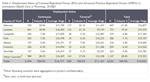 |
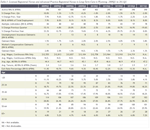
Table 4 illustrates how RN and APRN wages vary by county of work and employment status. Work county assignments were modeled using estimated commuting patterns (Leonard, 2011). Nurses’ work locations were estimated using the addresses contained in the employer UI tax files (QCEW). Work locations (latitude and longitude) were assigned based upon employers’ physical addresses. The statewide average wage for all continuously employed RNs & APRNs in health care during 2010Q4 was $16,771, while nurses experiencing other types of employment status (hire, exit, or hire and exit in the same quarter) earned considerably less ($11,161). Although the most RNs and APRNs were found to be working in Natrona County (847), the highest paid nurses (of the counties displayed) were found in Campbell County ($17,870 continuous; $17,369 average). The range for the published counties was from a high of $17,369 in Campbell County to a low of $14,524 in Fremont County. The difference could be accounted for by at least three factors: 1) more rural areas have less specialization or demand for nurse specialists or APRNs; 2) employers pay less because some local economies are not as robust as others; and 3) a greater proportion of nurses (33, or 12.7%) in Fremont County were in turnover status, or working less than a full quarter, compared to nurses in Campbell County (28, or 10.2%) of nurses.
Conclusion
This article examined how RN and APRN demographics and wages changed in the three health care industries between 2009Q1 and 2011Q1. The research was designed to update readers on wage and demographic changes in the nursing profession and to educate them in the use of the dashboard reports. The results indicate that both nurse wages and their average ages are increasing. This presents a challenge for Wyoming’s health care delivery system as more of the baby boom generation retires. How Wyoming’s health care system responds to competition that is not only local but global in nature will determine the quality of care delivered to the people of the state.
References
American Recovery and Reinvestment Act of 2009. Public Law 111-5. Retrieved December 12, 2011 from http://www.gpo.gov/fdsys/pkg/PLAW-111publ5/pdf/PLAW-111publ5.pdf
Harris, M. (2007). Where did the nurse go? Wyoming Labor Force Trends 44(6). Retrieved December 9, 2011 from http://doe.state.wy.us/LMI/0607/a1.htm
Leonard, D. (2011). Commuting patterns data model. Unpublished raw data.
Leonard, D. (2008). The NEW Report: Nurse Employment in Wyoming (NEW), Second Quarter 2006 Through Second Quarter 2008. Retrieved December 12, 2011 from http://doe.state.wy.us/LMI/dashboard/toc.htm
Patient Protection and Affordable Care Act of 2010. Public Law 111-148. Retrieved December 12, 2011, from http://www.gpo.gov/fdsys/pkg/PLAW-111publ148/pdf/PLAW-111publ148.pdf
United States Department of Commerce, Bureau of the Census. (2011). North American Industry Classification System. Retrieved December 9, 2011 from http://www.census.gov/eos/www/naics/
United States Department of Labor, Bureau of Labor Statistics. (2011). Current employment statistics. Retrieved December 15, 2011 from http://www.bls.gov/ces/
United States Department of Labor, Bureau of Labor Statistics. (2011). Quarterly census of employment and wages. Retrieved December 15, 2011 from http://www.bls.gov/cew/
Wyoming Department of Workforce Services, Research & Planning. (2011). Quarterly census of employment and wages. Unpublished raw data.
Wyoming Department of Workforce Services, Research & Planning. (2011). Wyoming industry turnover by year and quarter, 1992Q1 to 2010Q4. Retrieved December 15, 2011 from http://doe.state.wy.us/LMI/turnover.htm
Wyoming Department of Workforce Services, Research & Planning. (2011). Unemployment insurance claims database. Unpublished raw data.
Wyoming Department of Workforce Services, Research & Planning. (2011). Wage records database. Unpublished raw data.
Wyoming Department of Workforce Services, Research & Planning. (2011). Workers’ compensation database. Unpublished raw data.
Wyoming State Board of Nursing. (2011). Licensure file. Unpublished raw data.