An Overview of Wyoming's Unemployment Insurance Trust Fund and Trust Fund Liability
See Related Tables and Figures
Despite enduring a recent economic downturn, the Wyoming unemployment insurance (UI) trust fund remained solvent. This article provides a detailed look at the history of the state UI trust fund, including four periods of economic downturn. The second part of this article presents a trust fund liability study that examines four different scenarios that would affect the solvency of the trust fund.
The Great Recession has been over for more than two years (National Bureau of Economic Research, 2010), but the national unemployment rate still exceeded 9.0% as of September 2011 (see related article). As of November 28, 2011, 30 states had borrowed between $62.5 million (Delaware) and $9.3 billion (California) from the federal government to pay unemployment insurance (UI) benefits to unemployed workers (see Figure 1). Consequently, these states are facing many serious issues, such as continued payment of current UI claims and concurrent repayment of federal loans and interest. Some states will have to raise UI tax rates for many years to repay loans, and some may have to reduce UI benefits. Many may have to do both in order to get their states' UI trust funds back on track and stay solvent.
Wyoming is one of 20 states with a UI trust fund that didn't go broke during the recent economic downturn and won't have to face these problems. Nonetheless, it is necessary to review past experiences and present circumstances to evaluate what may be the likely liability of Wyoming's UI trust fund.
This article is divided into two sections: A 33-year overview (1978 to 2010) of Wyoming's UI history, and examination of Wyoming's current UI situation and possible liability of its UI trust fund under different scenarios.
UI History
Wyoming UI data from 1978 to 2010 show that the state's UI program experienced four major downturns (see Figure 2). For the purposes of this article, an economic downturn is defined as a period when the annual UI benefit expenses exceed annual UI tax collection, and the UI trust fund balance declined for two years or more (see Table 1).
Comparing Wyoming's
Economic Downturns
The first economic downturn in Wyoming's UI history was from 1982 to 1983, when international oil prices collapsed due to overproduction by the members of the Organization of the Petroleum Exporting Countries (OPEC) as well as increased production from non-OPEC sources. The imported oil price dropped from $37.05 per barrel in 1981 to $29.30 in 1983 (-20.9%; Casper Star-Tribune, 1999). During those two years, Wyoming lost an average of 20,618 jobs annually from 1981 to 1983 (see Table 2). In 1983, Wyoming's UI division processed 53,643 initial claims and 615,958 continued claims (Research & Planning, 2011). The UI division also paid $76 million in UI benefits (see Table 3). Both claims and benefit levels reached 33-year peaks in 1983 (see Figure 3 and Table 2). The UI trust fund faced a serious solvency problem, as the balance dropped to $2.8 million in third quarter 1983 and only held $5.4 million by the end of the year.
What are nominal and real values?
- Nominal
- The value of an economic variable in terms of the price level at the time of its measurement; or, unadjusted for price movements.
- Real
- The value of an economic variable adjusted for price movements.
Source: Federal Reserve Bank of Dallas. (N.D.). Deflating Nominal Values to Real Values. Retrieved December 6, 2011.
The most recent economic downturn – the fourth in UI records – was from 2009 to 2010, and was associated with the Great Recession and large price decreases in crude oil and natural gas. Wyoming's oil price dropped from a high of $120.15 per barrel in July 2008 to $27.50 in December 2008 (U.S. Energy Information Administration, 2011a). The average natural gas price decreased from $9.12 per thousand cubic feet (Mcf) in July 2008 to $2.54 per Mcf in June 2009. During this downturn, Wyoming lost an average of 15,226 jobs annually from 2008 to 2010 (U.S. Bureau of Labor Statistics, 2011a). In 2009, 54,460 initial claims and 507,461 continued claims were filed and $161.5 million in UI benefits were paid from the state UI trust fund, which was the highest in history in terms of nominal dollars (see related box on nominal and real values). In 2010, another $119.9 million in UI benefits were paid to claimants. By the end of first quarter 2011, the UI trust fund balance fell to $139.5 million from $283.1 million in fourth quarter 2008, a decline of 50.7%. It was also the lowest reserve level since third quarter 1996.
The two economic downturns can be compared by using the consumer price index (U.S. Bureau of Labor Statistics, 2011b) and taking inflation over the 33 years into consideration. Wyoming paid $153.0 million in UI benefits annually in real dollars during the first downturn, and $140.7 million in real dollars annually during the most recent downturn. This indicates that the most recent downturn was almost as severe as that of the early '80s, but Wyoming was in much better shape during the most recent downturn, in terms of trust fund solvency. The state UI trust fund balance dropped to $139.5 million compared to $2.8 million in the early '80s.
The downturn of the early '80s had a higher level of annual initial claims and continued claims than the most recent downturn: 56,069 compared to 49,653 for initial claims, and 548,644 compared to 461,677 for continued claims. However, the average annual duration and exhaustion rates in the most recent downturn were higher than they were in the downturn of the early '80s: 16.9 weeks compared to 15.5 weeks for average duration, and 51.5% compared to 44.5% for average annual exhaustion rate. This may be due to the high national long-term unemployment rate during the most recent downturn, which made it more difficult to find a job in Wyoming and in other states.
Other Periods of Downturn
There were two other downturns that were relatively modest, but worth mentioning.
The second downturn in UI records occurred from 1986 to 1987, associated with another large drop in oil prices; the cost of imported oil dropped from $26.99 per barrel in 1985 to $14.00 in 1986, (-48.1%). Wyoming lost 22,148 jobs during this period. In 1986, 60,441 initial claims and 432,925 continued claims were filed, and $61.9 million in UI benefits were paid. In 1987, another $50.8 million in UI benefits were paid and the UI trust fund balance fell to $17.1 million by the end of the year from the previous year's $34.4 million. The first downturn (1982 to 1983) triggered a higher UI tax rate, and as a result, tax collections were doubled or tripled. For example, UI tax collections in 1984 and 1985 were $55.3 million and $48.3 million, respectively; UI collections were only $13.1 million in 1980 and $16.5 million in 1981. A few years of large tax revenue collections prevented the Wyoming UI trust fund from insolvency during the second downturn.
The third downturn occurred from 2002 to 2003, and was associated with three external incidents:
-
The 2001 national recession;
-
The decline of oil and gas prices. Annual average crude oil prices declined from $30.26 per barrel in 2000 to $25.95 in 2001 (-14.2%) , while natural gas prices dropped from $6.82 per McF in January 2001 to $2.19 in February 2002 (-68.0%; U.S. Energy Information Administration, 2011b);
-
The two-year (2002 and 2003) UI tax rate reduction based on temporary UI law (Wyoming Employment Security Law, 2002 and 2003).
During this period, Wyoming lost 380 jobs, which was a result of 2,469 jobs lost in the private sector and 2,089 jobs gained in the government sector, according to data from the Quarterly Census of Employment and Wages. The number of initial UI claims climbed to more than 27,000 in both 2002 and 2003, a 42% increase compared to 2001. Annual UI benefit expenses also reached $46.5 million in 2003, the highest level since 1987. Unemployment insurance tax rate reductions of 30% in 2002 and 25% in 2003 led to much smaller revenue for these two years. The larger benefit expenses and smaller tax revenue collection reduced the UI trust fund balance to $194.4 million by the end of 2003 from $215.7 million in 2001. However, the UI trust fund was much stronger and healthier than during the past two downturns (i.e., the trust fund balance could cover another four years' benefit expenses at the 2003 level without considering increasing quarterly tax collections).
Current State Economic
and UI Situation
Wyoming's unemployment rate dropped to 5.8% in September 2011 from 6.7% in September 2010, and total non-farm employment increased by 8,600 jobs (3.0%; see related article). Initial UI claims declined from year-ago levels for six consecutive quarters beginning in first quarter 2010, while continued claims experienced over-the-year declines for five quarters beginning in second quarter 2010 (see Figure 4). These numbers suggest the state's economy is in recovery. However, both initial and continued claims levels were still much higher than during non-downturn years as of second quarter 2011. This higher-than-average claims level continued into third quarter 2011, and there were still 5,445 individuals collecting regular UI benefits in July 2011. This was more than double the July level in most non-downturn years. In addition, 3,098 long-term unemployed were collecting federally-supported Emergency Unemployment Compensation (EUC; see Figure 5 and Table 4). As of July 2011, Wyoming UI program benefit payments to claimants were more than double the regular years' levels. This long-lasting higher UI recipient level raises questions about how long the state UI trust fund can stay solvent and its liability level.
UI Trust Fund and Liability Study
Methodology
The most recent economic downturn was one of the costliest in Wyoming UI history. In nominal dollars, $161.5 million in UI benefits were paid from the state UI trust fund in 2009, the highest in history. The most reliable way to evaluate the liability of the state UI trust fund is to use the UI benefits expenses and industry distribution from 2009, the worst year. This allows for worst-case scenarios and most recent experiences are more representative and applicable for predicting trends in the near future.
The following research on UI benefits by industry is based on total benefits paid in the year, including all UI programs (regular, reimbursable, and EUC) because it is the only kind of data available detailed by industries.
Characteristics of the 2009 UI Experience
Nearly half of the UI benefits paid (46.9%) in 2009 went to claimants from two industries: construction ($62.7 million, or 28.8%) and mining ($39.5 million, or 18.1%; see Figure 6 and Table 5). Claimants from accommodation & food services obtained $16.4 million or 7.5%, followed by retail trade ($14.6 million; 6.7%), and administrative & waste services ($12.4 million; 5.7%). Together, these five industries' UI claimants withdrew more than two-thirds (66.8%) of all UI benefits in 2009. This study treats these industries collectively as major UI pay-out industries.
Job Loss and UI Recipient Ratio
In 2008 and 2009, Wyoming lost an average of 11,570 jobs annually, which accounted for 4.0% of all jobs in 2008, the year preceding the most recent economic downturn (see Table 6). Construction lost 15.1% of total jobs (4,260) and mining lost 13.0% (3,801), followed by retail trade (1,476; 4.6%) and accommodation & food services (1,463; 4.6%). Manufacturing and administrative & waste services both lost 8.4% or more of industry jobs, 851 and 679 jobs, respectively.
In Wyoming, one job loss resulted in about 3.1 UI recipients in 2009 (the number of recipients divided by the number of jobs lost). This study addresses net job gains or losses by industry, however, and job gains and losses may happen frequently in some companies or within the same industry. A net gain in jobs doesn't mean that there were no layoffs. Some industries, such as educational services and health care & social assistance, showed notable job gains (4.6% and 3.8%, respectively) in 2009 from year-ago levels, but also had a substantial number of unemployed workers collecting UI benefits: 614 and 1,677, respectively. The job loss-to-UI recipient ratio only represents some relationship between these two and will be used in the liability model later in this article.
Table 6 shows that information (6.2) and other services (6.0) had the highest ratio of UI recipients to jobs lost. The utilities industry (4.7) was the third highest; mining had 1.2 UI claimants per job lost, while construction had 2.4.
Liability Study Results
By using the UI experience and ratio of job loss to UI recipients from 2009, a UI trust fund liability model is constructed. With this model, the liability level of the state UI trust fund can be tested under different scenarios.
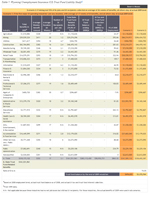
The first model uses the actual situation from 2009, the annual average employment level from 2008, the UI trust fund balance as of fourth quarter 2008, and the UI tax revenue and trust fund interest collections from all four quarters of 2009 (see Table 7). Under Scenario 1, the five industries with the largest UI benefit payments have job losses double their 2009 levels and pay claimants for 17 weeks. The UI trust fund balance at the end of the year would be $476,035 under this scenario. If this were to happen, the state UI trust fund could meet its obligation for just one year.
In Scenario 2, if all other industries replicated their 2009 performance, but mining lost 53% of its jobs in 2009 instead of the actual 13%, and all mining UI claimants collected benefits for 26 weeks, the total UI benefit expenses would be $338.7 million for the year. The state UI trust fund balance would be $3.4 million by the end of 2009, also a very dangerous level.
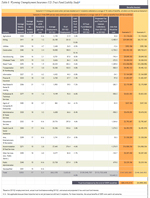
A second "what-if" test uses the average employment level from first quarter 2011, the UI trust fund balance as of the end of first quarter 2011, and the actual projected UI tax revenue and trust fund interest collections from second quarter 2011 to first quarter 2012 (see Table 8). Under Scenario 3, there is another economic downturn similar to 2009, which means that all industries lost the same percentage of jobs as in 2009, and all UI claimants collect UI benefits for 17 weeks (the average weekly benefit level in 2009). A total of $167.9 million would be spent by the end of first quarter 2012, and the state trust fund balance would be at $85.4 million. This would not be immediately dangerous, but much worse than the situation in fourth quarter 2009, when the trust fund balance was $179.8 million. Wyoming is not completely out of the last downturn yet, and the trust fund balance is much lower now than it was at the beginning of the recent downturn.
In Scenario 4, all other industries stay the same as in Scenario 3, but mining and construction lose twice as many jobs, 26.0% and 30.2%, respectively. A total of $248.3 million in UI benefits would be expended by the end of first quarter 2012, leaving the state UI trust fund near broke at about $5.0 million. Again, this is about one year of liability.
Summary
After two and a half years of high UI benefit expenses, Wyoming's UI trust fund is at a relatively low balance ($166.5 million as of the end of second quarter 2011). A higher UI tax rate was implemented in 2010 and 2011, and will last for a few years. Wyoming's UI trust fund should remain solvent for several years as long as there is not another severe economic downturn.
References
National Bureau of Economic Research. (2010, September). News release. Retrieved December 16, 2011, from http://www.nber.org/cycles/sept2010.html
Casper Star-Tribune. (1999, December 27). Oil embargo sparks energy boom. Retrieved November 14, 2011.
U.S. Bureau of Labor Statistics. (2011a). Quarterly Census of Employment and Wages. Retrieved December 16, 2011, from http://doe.state.wy.us/LMI/toc_202.htm
U.S. Bureau of Labor Statistics. (2011b). Consumer Price Index. Retrieved December 16, 2011, from http://data.bls.gov/pdq/
Research & Planning. (2011). Unemployment insurance statistics. Retrieved December 16, 2011, from http://doe.state.wy.us/LMI/ui.htm
U.S. Energy Information Administration. (2011a). Wyoming crude oil first purchase price (dollars per barrel). Retrieved December 23, 2011, from http://tinyurl.com/8x22y9z
U.S. Energy Information Administration. (2011b). Cushing, OK crude oil future contract 1 (dollars per barrel) and U.S. natural gas wellhead price (dollars per thousand cubic feet). Retrieved December 19, 2011, from http://tinyurl.com/7ubaeww and http://http://tinyurl.com/7gqxy4z
Wyoming Employment Security Law 27-3-503. (2002, 2003, and 2004). Retrieved December 19, 2011, from http://legisweb.state.wy.us/statutes/statutes.aspx?file=titles/
Title27/Title27.htm


