
An overview of Wyoming's Unemployment Insurance Trust Fund and Trust Fund Liability
(Tables and Figures)
See Related Article
Figures: 1, 2, 3, 4, 5, 6
Tables: 1, 2, 3, 4, 5, 6, 7, 8
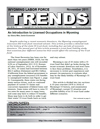
Figure 1
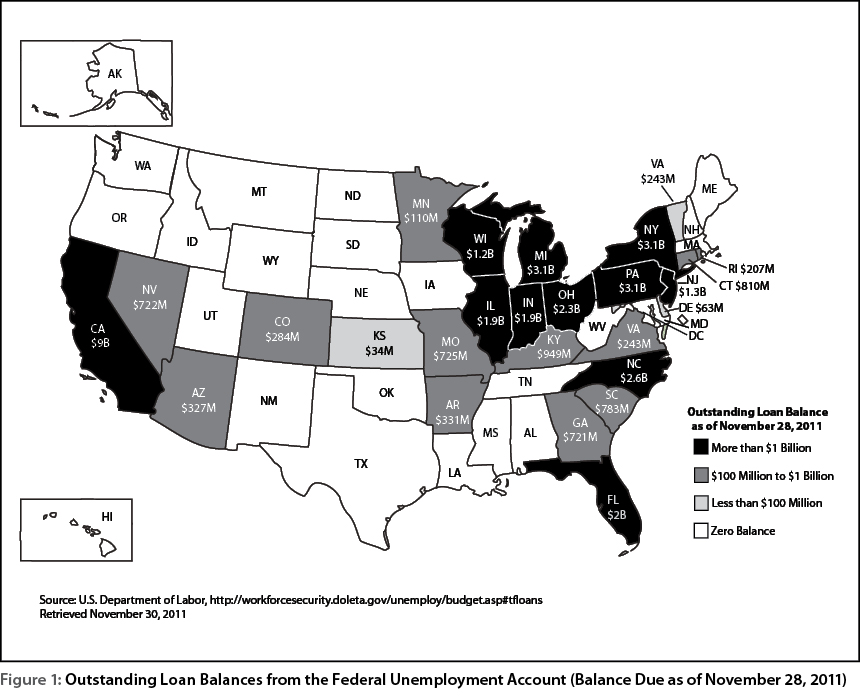
Figure 2
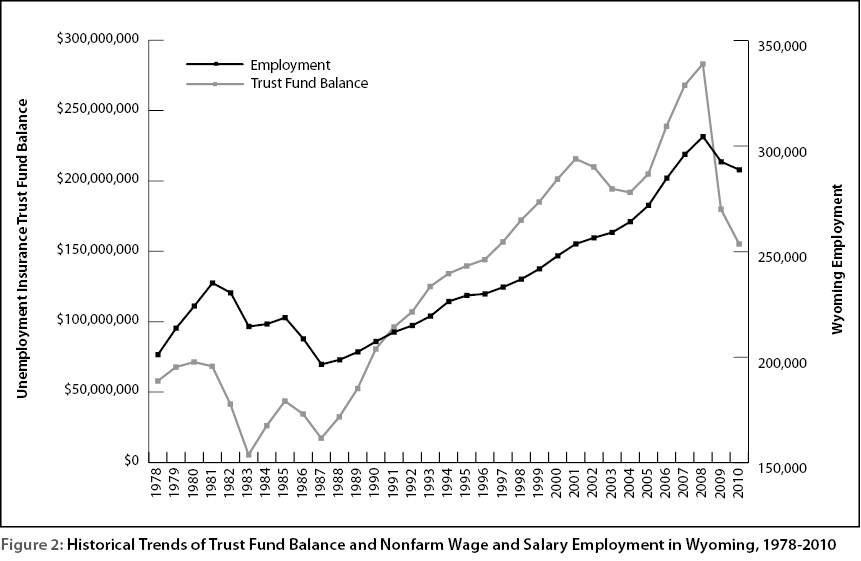
Table1
| Year | Ending Balance | Contributions | Benefits | Net Contributions |
Ending Balance Over-the-Year Change |
|---|---|---|---|---|---|
| 1978 | 57,858,914 | 18,031,550 | 7,509,371 | 10,522,180 | |
| 1979 | 67,730,151 | 14,701,991 | 8,353,381 | 6,348,611 | 17.1% |
| 1980 | 71,315,840 | 13,121,429 | 16,166,205 | -3,044,776 | 5.3% |
| 1981 | 68,292,165 | 16,568,541 | 26,606,654 | -10,038,113 | -4.2% |
| 1982 | 41,301,793 | 26,069,735 | 62,573,122 | -36,503,387 | -39.5% |
| 1983 | 5,461,599 | 40,005,461 | 76,116,905 | -36,111,445 | -86.8% |
| 1984 | 26,181,897 | 55,334,331 | 34,166,767 | 21,167,564 | 379.4% |
| 1985 | 43,560,948 | 48,377,610 | 33,924,340 | 14,453,269 | 66.4% |
| 1986 | 34,426,896 | 48,031,178 | 61,865,353 | -13,834,175 | -21.0% |
| 1987 | 17,160,905 | 33,338,587 | 50,813,269 | -17,474,683 | -50.2% |
| 1988 | 32,439,077 | 38,891,647 | 25,067,419 | 13,824,228 | 89.0% |
| 1989 | 52,539,386 | 39,913,754 | 22,373,278 | 17,540,476 | 62.0% |
| 1990 | 80,553,941 | 41,736,917 | 18,076,646 | 23,660,272 | 53.3% |
| 1991 | 96,093,278 | 31,909,492 | 23,663,189 | 8,246,304 | 19.3% |
| 1992 | 106,970,242 | 30,686,300 | 27,783,035 | 2,903,265 | 11.3% |
| 1993 | 124,965,892 | 32,252,633 | 22,534,696 | 9,717,937 | 16.8% |
| 1994 | 134,155,922 | 25,966,576 | 25,352,175 | 614,401 | 7.4% |
| 1995 | 139,602,411 | 24,734,888 | 28,640,195 | -3,905,307 | 4.1% |
| 1996 | 144,127,596 | 24,934,159 | 30,162,239 | -5,228,080 | 3.2% |
| 1997 | 156,708,102 | 27,957,658 | 25,297,320 | 2,660,339 | 8.7% |
| 1998 | 172,105,327 | 29,343,625 | 24,711,494 | 4,632,132 | 9.8% |
| 1999 | 185,062,023 | 28,500,546 | 26,587,941 | 1,912,605 | 7.5% |
| 2000 | 201,283,924 | 29,070,324 | 24,764,048 | 4,306,276 | 8.8% |
| 2001 | 215,645,924 | 27,428,219 | 25,455,845 | 1,972,374 | 7.1% |
| 2002 | 209,950,216 | 20,504,313 | 38,533,939 | -18,029,626 | -2.6% |
| 2003 | 194,367,590 | 19,382,515 | 46,523,683 | -27,141,168 | -7.4% |
| 2004 | 191,851,552 | 26,591,680 | 39,816,356 | -13,224,676 | -1.3% |
| 2005 | 204,878,612 | 35,655,397 | 32,783,056 | 2,872,342 | 6.8% |
| 2006 | 238,797,780 | 51,522,114 | 27,917,448 | 23,604,666 | 16.6% |
| 2007 | 267,882,953 | 51,796,131 | 33,901,474 | 17,894,658 | 12.2% |
| 2008 | 283,112,420 | 53,526,806 | 49,944,949 | 3,581,857 | 5.7% |
| 2009 | 179,839,606 | 48,343,577 | 161,531,961 | -113,188,384 | -36.5% |
| 2010 | 155,150,542 | 85,875,248 | 119,947,743 | -34,072,495 | -13.7% |
Table2
| Average Annual Unemployment Insurance Benefit (Related to State Trust Fund) | Average Annual Weekly Benefit Amount c | Average Weekly Wage | |||||||||
|---|---|---|---|---|---|---|---|---|---|---|---|
| Wyoming Economic Downturn Periods |
Total Jobs Losta | Nominal Dollars |
Real Dollars, Based on Consumer Price Indexb | Average Annual Iniital Claims (Related to State Trust Fund) | Average Annual Weeks Claimed (Related to State Trust Fund) | Average Annual Duration (in Weeks)c | Average Annual Exhaustion Ratesc | Nominal Dollars | Real Dollars, Based on Consumer Price Indexb | Nominal Dollars | Real Dollars, Based on Consumer Price Indexb |
| 1982-1983 | 20,618 | $69,345,014 | $152,975,100 | 56,069 | 548,644 | 15.5 | 44.50% | $132.42 | $292.12 | 348.11 | $767.93 |
| 1986-1987 | 22,148 | $56,339,311 | $109,185,585 | 51,536 | 385,753 | 17.3 | 34.10% | $160.76 | $311.55 | 355.98 | $689.88 |
| 2002-2003 | 380 | $41,624,659 | $48,867,350 | 26,355 | 198,096 | 11.7 | 28.70% | $236.15 | $277.24 | 566.06 | $664.55 |
| 2009-2010 | 15,226 | $140,739,852 | $140,739,852 | 49,653 | 461,677 | 16.9 | 51.50% | $330.66 | $330.66 | 795.13 | $795.13 |
| Normal Annual Average | $28,155,378 | 26,831 | 182,921 | 13.3 | 28.20% | ||||||
| aAnnual average employment difference between peak year and trough year. Data from 1982 to 1987 are based on the nonfarm wage and salary employment from the U.S. Bureau of Economic Analysis. Data from 2002 to 2010 are based on the Quarterly Census of Employment and Wages from the U.S. Bureau of Labor Statistics. | |||||||||||
| bU.S. Bureau of Labor Statistics, Consumer Price Index. Base period: 1982-1984 = 100. | |||||||||||
| cData from 1982-1998 were from ET Handbook NO. 394, Employment and Training Administration of the U.S. Department of Labor. Data from 1999 to present were from Unemployment Insurance Data Summary, http://workforcesecurity.doleta.gov/unemploy/content/data.asp. | |||||||||||
| dExcludes all economic downturn periods. | |||||||||||
Table3
|
| |||
| Year | Unemployment Insurance Benefit |
Initial Claims |
Continued Claims |
|---|---|---|---|
| 1982 | $62,573,122 | 58,495 | 481,330 |
| 1983 | $76,116,905 | 53,643 | 615,958 |
| 1984 | $34,166,767 | 31,630 | 264,612 |
| 1985 | $33,924,340 | 42,715 | 259,258 |
| 1986 | $61,865,353 | 60,441 | 432,925 |
| 1987 | $50,813,269 | 42,630 | 338,581 |
| 1988 | $25,067,419 | 33,741 | 203,656 |
| 1989 | $22,373,278 | 30,822 | 186,926 |
| 1990 | $18,076,646 | 28,745 | 158,244 |
| 1991 | $23,663,189 | 32,946 | 188,662 |
| 1992 | $27,783,035 | 32,371 | 214,676 |
| 1993 | $22,534,696 | 25,817 | 179,502 |
| 1994 | $25,352,175 | 25,396 | 187,530 |
| 1995 | $28,640,195 | 26,227 | 203,859 |
| 1996 | $30,162,239 | 28,216 | 216,834 |
| 1997 | $25,297,320 | 24,390 | 179,304 |
| 1998 | $24,711,494 | 24,488 | 165,804 |
| 1999 | $26,587,941 | 22,396 | 163,650 |
| 2000 | $24,764,048 | 20,775 | 149,235 |
| 2001 | $25,455,845 | 19,341 | 151,345 |
| 2002 | $38,533,939 | 27,364 | 195,186 |
| 2003 | $46,523,683 | 27,369 | 213,251 |
| 2004 | $39,816,356 | 24,332 | 185,852 |
| 2005 | $32,783,055 | 21,309 | 152,989 |
| 2006 | $27,917,448 | 17,974 | 127,639 |
| 2007 | $33,901,473 | 20,903 | 135,978 |
| 2008 | $49,944,949 | 26,422 | 168,710 |
| 2009 | $161,531,961 | 54,460 | 507,461 |
| 2010 | $119,947,743 | 44,846 | 415,892 |
Figure3
Figure 4
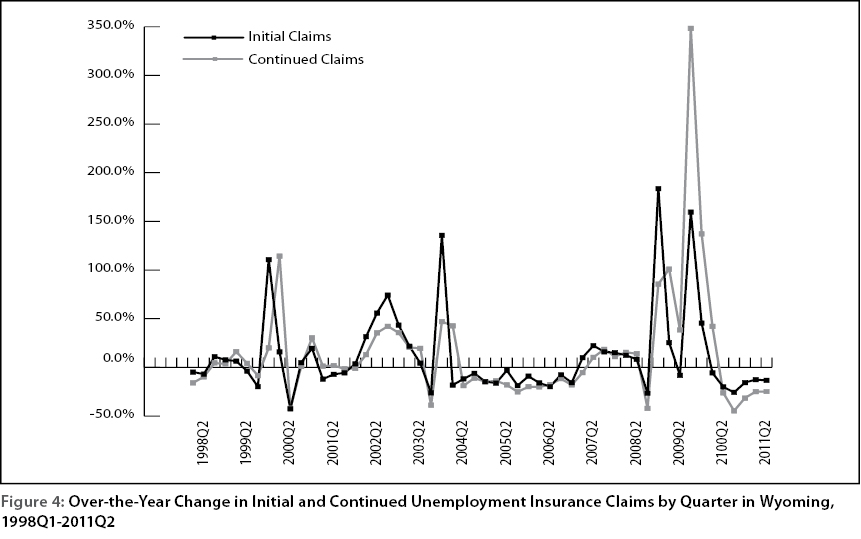
Figure 5
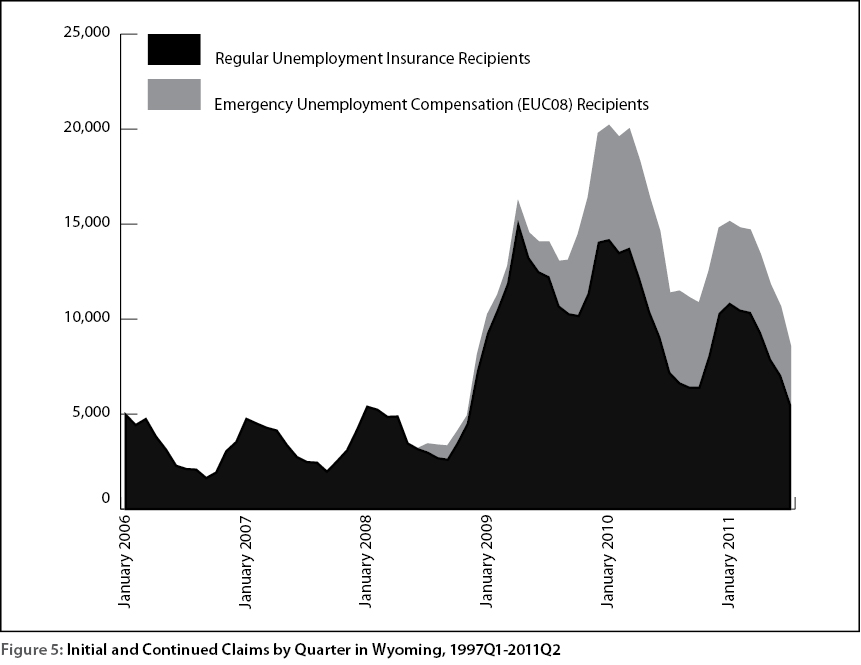
Table 4
| Regular UI Recipients | Over-the-Year Change | EUC 08 Recipients | Over-the-Year Change | Total UI Recipients | Over-the-Year Change | |
|---|---|---|---|---|---|---|
| Jan.06 | 4,955 | 4,955 | ||||
| Feb.06 | 4,416 | 4,416 | ||||
| Mar.06 | 4,731 | 4,731 | ||||
| Apr.06 | 3,813 | 3,813 | ||||
| May.06 | 3,127 | 3,127 | ||||
| Jun.06 | 2,277 | 2,277 | ||||
| Jul.06 | 2,103 | 2,103 | ||||
| Aug.06 | 2,071 | 2,071 | ||||
| Sep.06 | 1,624 | 1,624 | ||||
| Oct.06 | 1,919 | 1,919 | ||||
| Nov.06 | 3,037 | 3,037 | ||||
| Dec.06 | 3,529 | 3,529 | ||||
| Jan.07 | 4,739 | -4.4% | 4,739 | -4.4% | ||
| Feb.07 | 4,497 | 1.8% | 4,497 | 1.8% | ||
| Mar.07 | 4,273 | -9.7% | 4,273 | -9.7% | ||
| Apr.07 | 4,127 | 8.2% | 4,127 | 8.2% | ||
| May.07 | 3,369 | 7.7% | 3,369 | 7.7% | ||
| Jun.07 | 2,737 | 20.2% | 2,737 | 20.2% | ||
| Jul.07 | 2,468 | 17.4% | 2,468 | 17.4% | ||
| Aug.07 | 2,436 | 17.6% | 2,436 | 17.6% | ||
| Sep.07 | 1,957 | 20.5% | 1,957 | 20.5% | ||
| Oct.07 | 2,508 | 30.7% | 2,508 | 30.7% | ||
| Nov.07 | 3,082 | 1.5% | 3,082 | 1.5% | ||
| Dec.07 | 4,173 | 18.2% | 4,173 | 18.2% | ||
| Jan.08 | 5,379 | 13.5% | 5,379 | 13.5% | ||
| Feb.08 | 5,222 | 16.1% | 5,222 | 16.1% | ||
| Mar.08 | 4,845 | 13.4% | 4,845 | 13.4% | ||
| Apr.08 | 4,867 | 17.9% | 4,867 | 17.9% | ||
| May.08 | 3,451 | 2.4% | 3,451 | 2.4% | ||
| Jun.08 | 3,151 | 15.1% | 3,151 | 15.1% | ||
| Jul.08 | 2,963 | 20.1% | 438 | 3,401 | 37.8% | |
| Aug.08 | 2,671 | 9.6% | 664 | 3,335 | 36.9% | |
| Sep.08 | 2,590 | 32.3% | 702 | 3,292 | 68.2% | |
| Oct.08 | 3,468 | 38.3% | 606 | 4,074 | 62.4% | |
| Nov.08 | 4,502 | 46.1% | 404 | 4,906 | 59.2% | |
| Dec.08 | 7,262 | 74.0% | 878 | 8,140 | 95.1% | |
| Jan.09 | 9,241 | 71.8% | 996 | 10,237 | 90.3% | |
| Feb.09 | 10,490 | 100.9% | 771 | 11,261 | 115.6% | |
| Mar.09 | 11,869 | 145.0% | 906 | 12,775 | 163.7% | |
| Apr.09 | 14,945 | 207.1% | 1,105 | 16,050 | 229.8% | |
| May.09 | 13,204 | 282.6% | 1,318 | 14,522 | 320.8% | |
| Jun.09 | 12,459 | 295.4% | 1,576 | 14,035 | 345.4% | |
| Jul.09 | 12,200 | 311.7% | 1,835 | 14,035 | 312.7% | |
| Aug.09 | 10,664 | 299.3% | 2,341 | 252.6% | 13,005 | 290.0% |
| Sep.09 | 10,248 | 295.7% | 2,820 | 301.7% | 13,068 | 297.0% |
| Oct.09 | 10,155 | 192.8% | 4,289 | 607.8% | 14,444 | 254.5% |
| Nov.09 | 11,337 | 151.8% | 5,061 | 1,152.7% | 16,398 | 234.2% |
| Dec.09 | 14,016 | 93.0% | 5,749 | 554.8% | 19,765 | 142.8% |
| Jan.10 | 14,147 | 53.1% | 6,002 | 502.6% | 20,149 | 96.8% |
| Feb.10 | 13,467 | 28.4% | 6,066 | 686.8% | 19,533 | 73.5% |
| Mar.10 | 13,683 | 15.3% | 6,271 | 592.2% | 19,954 | 56.2% |
| Apr.10 | 12,103 | -19.0% | 6,217 | 462.6% | 18,320 | 14.1% |
| May.10 | 10,348 | -21.6% | 6,016 | 356.4% | 16,364 | 12.7% |
| Jun.10 | 9,039 | -27.5% | 5,581 | 254.1% | 14,620 | 4.2% |
| Jul.10 | 7,168 | -41.2% | 4,162 | 126.8% | 11,330 | -19.3% |
| Aug.10 | 6,613 | -38.0% | 4,826 | 106.2% | 11,439 | -12.0% |
| Sep.10 | 6,382 | -37.7% | 4,708 | 67.0% | 11,090 | -15.1% |
| Oct.10 | 6,386 | -37.1% | 4,412 | 2.9% | 10,798 | -25.2% |
| Nov.10 | 8,054 | -29.0% | 4,464 | -11.8% | 12,518 | -23.7% |
| Dec.10 | 10,281 | -26.6% | 4,497 | -21.8% | 14,778 | -25.2% |
| Jan.11 | 10,790 | -23.7% | 4,305 | -28.3% | 15,095 | -25.1% |
| Feb.11 | 10,443 | -22.5% | 4,328 | -28.7% | 14,771 | -24.4% |
| Mar.11 | 10,320 | -24.6% | 4,342 | -30.8% | 14,662 | -26.5% |
| Apr.11 | 9,270 | -23.4% | 4,119 | -33.7% | 13,389 | -26.9% |
| May.11 | 7,859 | -24.1% | 3,943 | -34.5% | 11,802 | -27.9% |
| Jun.11 | 7,018 | -22.4% | 3,637 | -34.8% | 10,655 | -27.1% |
| Jul.11 | 5,445 | -24.0% | 3,098 | -25.6% | 8,543 | -24.6% |
Figure 6
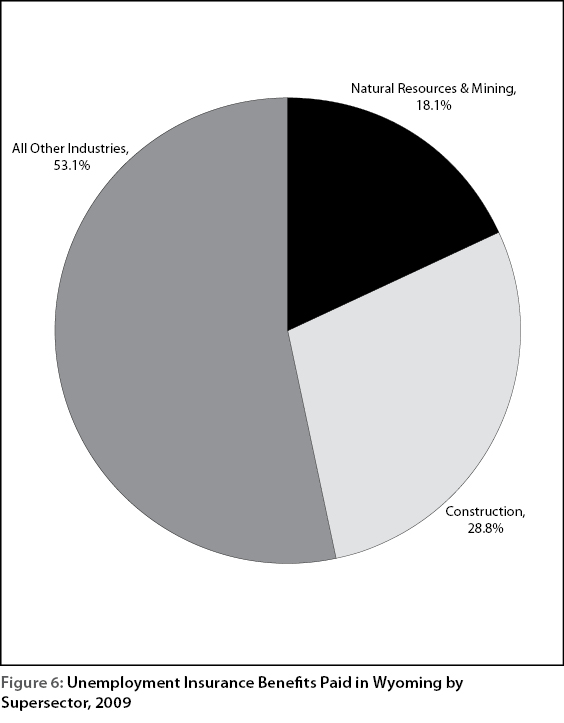
Table 5
| Recipients | % of total | UI Benefits | % of total | ||
|---|---|---|---|---|---|
| Agriculture | 278 | 0.8% | 1,510,886 | 0.7% | |
| Mining | 4,739 | 13.1% | 39,539,324 | 18.1% | |
| Utilities | 59 | 0.2% | 411,617 | 0.2% | |
| Construction | 10,193 | 28.2% | 62,764,892 | 28.8% | |
| Manufacturing | 1,760 | 4.9% | 9,749,383 | 4.5% | |
| Wholesale Trade | 866 | 2.4% | 6,001,455 | 2.8% | |
| Retail Trade | 2,813 | 7.8% | 14,579,391 | 6.7% | |
| Transportation & Warehousing | 1,588 | 4.4% | 10,006,323 | 4.6% | |
| Information | 222 | 0.6% | 1,510,639 | 0.7% | |
| Finance & Insurance | 312 | 0.9% | 1,854,250 | 0.8% | |
| Real Estate & Rental & Leasing | 407 | 1.1% | 2,996,385 | 1.4% | |
| Professional & Technical Services | 995 | 2.8% | 7,306,272 | 3.3% | |
| Mgmt.of Companies & Enterprises | 35 | 0.1% | 400,720 | 0.2% | |
| Administrative & Waste Services | 2,164 | 6.0% | 12,379,176 | 5.7% | |
| Educational Services | 614 | 1.7% | 3,771,915 | 1.7% | |
| Health Care & Social Assistance | 1,677 | 4.6% | 8,769,200 | 4.0% | |
| Arts, Entertainment, & Recreation | 361 | 1.0% | 1,807,553 | 0.8% | |
| Accommodation & Food Services | 4,109 | 11.4% | 16,449,599 | 7.5% | |
| Other Services (except Public Administration) | 924 | 2.6% | 5,771,448 | 2.6% | |
| Public Administration | 1,372 | 3.8% | 7,062,691 | 3.2% | |
| Nonclassified* | 672 | 1.9% | 3,530,003 | 1.6% | |
| Total | 36,160 | 100.0% | 218,173,122 | 100.0% | |
Table 6
| Industry | 2008 Average Annual Employment |
2009 Average Annual Employment |
Over-the-Year Change (Job Loss) |
UI Recipients in 2009a | Number of UI Recipients per Job Lost | |
|---|---|---|---|---|---|---|
| n | % | |||||
| Agriculture | 2,447 | 2,495 | 48 | 2.0% | 278 | N/A |
| Mining | 29,266 | 25,466 | -3,801 | -13.0% | 4,739 | 1.2 |
| Utilities | 2,668 | 2,655 | -13 | -0.5% | 59 | 4.7 |
| Construction | 28,163 | 23,903 | -4,260 | -15.1% | 10,193 | 2.4 |
| Manufacturing | 9,962 | 9,111 | -851 | -8.5% | 1,760 | 2.1 |
| Wholesale Trade | 9,146 | 8,751 | -395 | -4.3% | 866 | 2.2 |
| Retail Trade | 32,294 | 30,818 | -1,476 | -4.6% | 2,813 | 1.9 |
| Transportation & Warehousing | 10,970 | 10,440 | -530 | -4.8% | 1,588 | 3 |
| Information | 4,695 | 4,659 | -36 | -0.8% | 222 | 6.2 |
| Finance & Insurance | 7,252 | 7,148 | -104 | -1.4% | 312 | 3 |
| Real Estate & Rental & Leasing | 4,480 | 4,160 | -320 | -7.2% | 407 | 1.3 |
| Professional & Technical Services | 10,083 | 9,480 | -603 | -6.0% | 995 | 1.6 |
| Mgmt.of Companies & Enterprises | 793 | 745 | -48 | -6.1% | 35 | 0.7 |
| Administrative & Waste Services | 8,102 | 7,422 | -679 | -8.4% | 2,164 | 3.2 |
| Educational Services | 26,312 | 27,518 | 1,206 | 4.6% | 614 | N/A |
| Health Care & Social Assistance | 31,381 | 32,580 | 1,199 | 3.8% | 1,677 | N/A |
| Arts, Entertainment, & Recreation | 4,287 | 4,328 | 40 | 0.9% | 361 | N/A |
| Accommodation & Food Services | 31,682 | 30,219 | -1,463 | -4.6% | 4,109 | 2.8 |
| Other Services (exc. Public Admin.) | 8,868 | 8,714 | -154 | -1.7% | 924 | 6 |
| Public Administration | 23,479 | 24,151 | 672 | 2.9% | 1,372 | N/A |
| Nonclassified | 672 | N/A | ||||
| Total | 286,332 | 274,763 | -11,570 | -4.0% | 36,160 | 3.1 |
| aFrom 1099 data. | ||||||
| N/A - Not applicable because these industries had no net job losses but still had UI recipients. | ||||||
Table 7
| Benefits Needed | ||||||||||
| Scenario 2: If mining lost 53% of its jobs and UI recipients collected an average of 26 weeks of benefits, all others stay at actual 2009 level | ||||||||||
| Scenario 1: If the five major UI spending industries’ job loss doubled, with average of 17 weeks of UI benefits, and all others stay at actual 2009 level | Scenario 2: | |||||||||
| Industry | Total Benefits in 2009b | Average Weekly Benefit Amount | Average Duration (Weeks) | Number of UI Recipients per Job Lost | Total State Trust Fund-Related Benefits (74.0% of Total) | UI Trust Fund Balance ending 2008Q4 | UI Tax and Trust Fund Collection from 2009Q1 to 2009Q4 | 1% of 2008 Employment | Scenario 1: | |
|---|---|---|---|---|---|---|---|---|---|---|
| Agriculture | $1,510,886 | $328 | 17 | N/A | $1,118,636 | --- | --- | 24.47 | $1,118,636 | $1,118,636 |
| Mining | $39,539,324 | $411 | 20 | 1.2 | $29,274,296 | -- | -- | 292.66 | $66,214,911 | $206,434,722 |
| Utilities | $411,617 | $394 | 18 | 4.7 | $304,755 | -- | -- | 26.68 | $304,755 | $304,755 |
| Construction | $62,764,892 | $382 | 16 | 2.4 | $46,470,143 | -- | -- | 281.63 | $132,210,271 | $46,470,143 |
| Manufacturing | $9,749,383 | $346 | 16 | 2.1 | $7,218,290 | -- | -- | 99.62 | $7,218,290 | $7,218,290 |
| Wholesale Trade | $6,001,455 | $375 | 19 | 2.2 | $4,443,383 | -- | -- | 91.46 | $4,443,383 | $4,443,383 |
| Retail Trade | $14,579,391 | $293 | 18 | 1.9 | $10,794,353 | -- | -- | 322.94 | $28,238,317 | $10,794,353 |
| Transportation & Warehousing | $10,006,323 | $373 | 17 | 3 | $7,408,525 | -- | -- | 109.7 | $7,408,525 | $7,408,525 |
| Information | $1,510,639 | $327 | 21 | 6.2 | $1,118,453 | -- | -- | 46.95 | $1,118,453 | $1,118,453 |
| Finance & Insurance | $1,854,250 | $334 | 18 | 3 | $1,372,858 | -- | -- | 72.52 | $1,372,858 | $1,372,858 |
| Real Estate & Rental & Leasing | $2,996,385 | $356 | 21 | 1.3 | $2,218,477 | -- | -- | 44.8 | $2,218,477 | $2,218,477 |
| Professional & Technical Services | $7,306,272 | $377 | 19 | 1.6 | $5,409,449 | -- | -- | 100.83 | $5,409,449 | $5,409,449 |
| Mgmt.of Companies & Enterprises | $400,720 | $382 | 30 | 0.7 | $296,687 | -- | -- | 7.93 | $296,687 | $296,687 |
| Administrative & Waste Services | $12,379,176 | $320 | 18 | 3.2 | $9,165,348 | -- | -- | 81.02 | $23,593,781 | $9,165,348 |
| Educational Services | $3,771,915 | $332 | 19 | N/A | $2,792,667 | -- | -- | 263.12 | $2,792,667 | $2,792,667 |
| Health Care & Social Assistance | $8,769,200 | $304 | 17 | N/A | $6,492,578 | -- | -- | 313.81 | $6,492,578 | $6,492,578 |
| Arts, Entertainment, & Recreation | $1,807,553 | $299 | 17 | N/A | $1,338,284 | -- | -- | 42.87 | $1,338,284 | $1,338,284 |
| Accommodation & Food Services | $16,449,599 | $271 | 15 | 2.8 | $12,179,025 | -- | -- | 316.82 | $37,683,040 | $12,179,025 |
| Other Services (exc. Public Admin.) | $5,771,448 | $355 | 18 | 6 | $4,273,090 | -- | -- | 88.68 | $4,273,090 | $4,273,090 |
| Public Administration | $7,062,691 | $340 | 15 | N/A | $5,229,106 | -- | -- | 234.79 | $5,229,106 | $5,229,106 |
| Nonclassified | $3,530,003 | $351 | 15 | N/A | $2,613,559 | -- | -- | 0 | $2,613,559 | $2,613,559 |
| A. Total | $218,173,122 | $353 | 17 | 3.1 | $161,531,961 | $283,112,420 | $58,952,731 | 2,863.32 | $341,589,116 | $338,692,387 |
| B. State Trust Fund-Related Benefits | $161,531,961 | |||||||||
| Ratio of B to A: | 74.0% | |||||||||
| Trust fund balance by the end of 2009 would be: | $476,035 | $3,372,764 | ||||||||
| aBased on 2008 employment level, actual trust fund balance as of 2008, and actual UI tax and trust fund interest collection. | ||||||||||
| bFrom 1099 data. | ||||||||||
| N/A - Not applicable because these industries had no net job losses but still had UI recipients. For those industries, the actual benefits of 2009 were used in all scenarios. | ||||||||||
Table 8
| Benefits Needed | |||||||||||
|---|---|---|---|---|---|---|---|---|---|---|---|
| Scenario 4: If mining and construction job loses doubled and UI recipients collected an average of 18 weeks of benefits, all others are the same as Scenario 3 | |||||||||||
| Scenario 3: If the 2009 job loss rates continued and UI recipients collected an average week of 17 weeks of benefits from 2011Q1 to 2012Q1 | Scenario 4 | ||||||||||
| Industry | Average Weekly Benefit Amount | Average Duration (in Weeks) in 2009 | Number of UI Recipients per Job Lost | Average Employment, 2011Q1 |
1% of 2011Q1 Employment |
Lost same % of Jobs as in 2009 |
UI Trust Fund Balance Ending 2011Q1 |
Projected Tax and Trust Fund Interest Collections from 2011Q2 to 2012Q1 | Jobs that Would be Lost | Scenario 3 | |
| Agriculture | $328 | 17 | N/A | 2,194 | 21.9 | 2.0% | 42.8 | $1,118,636 | $1,118,636 | ||
| Mining | $411 | 20 | 1.2 | 26,185 | 261.8 | -13.0% | -3,400.4 | $29,589,538 | $62,727,163 | ||
| Utilities | $394 | 18 | 4.7 | 2,648 | 26.5 | -0.5% | -12.6 | $392,186 | $392,186 | ||
| Construction | $382 | 16 | 2.4 | 18,050 | 180.5 | -15.1% | -2,730.3 | $42,442,165 | $89,720,611 | ||
| Manufacturing | $346 | 16 | 2.1 | 8,701 | 87.0 | -8.5% | -743.4 | $9,049,103 | $9,049,103 | ||
| Wholesale Trade | $375 | 19 | 2.2 | 8,626 | 86.3 | -4.3% | -372.5 | $5,200,510 | $5,200,510 | ||
| Retail Trade | $293 | 18 | 1.9 | 28,225 | 282.2 | -4.6% | -1,289.8 | $12,258,596 | $12,258,596 | ||
| Transportation & Warehousing | $373 | 17 | 3.0 | 10,350 | 103.5 | -4.8% | -500.4 | $9,492,123 | $9,492,123 | ||
| Information | $327 | 21 | 6.2 | 4,432 | 44.3 | -0.8% | -34.1 | $1,164,509 | $1,164,509 | ||
| Finance & Insurance | $334 | 18 | 3.0 | 6,765 | 67.7 | -1.4% | -97.0 | $1,652,547 | $1,652,547 | ||
| Real Estate & Rental & Leasing | $356 | 21 | 1.3 | 3,953 | 39.5 | -7.2% | -282.7 | $2,175,909 | $2,175,909 | ||
| Professional & Technical Services | $377 | 19 | 1.6 | 9,199 | 92.0 | -6.0% | -550.3 | $5,823,303 | $5,823,303 | ||
| Mgmt.of Companies & Enterprises | $382 | 30 | 0.7 | 862 | 8.6 | -6.1% | -52.5 | $247,104 | $247,104 | ||
| Administrative & Waste Services | $320 | 18 | 3.2 | 6,658 | 66.6 | -8.4% | -558.3 | $9,678,252 | $9,678,252 | ||
| Educational Services | $332 | 19 | N/A | 29,776 | 297.8 | 4.6% | 1,364.6 | $2,792,667 | $2,792,667 | ||
| Health Care & Social Assistance | $304 | 17 | N/A | 33,356 | 333.6 | 3.8% | 1,274.3 | $6,492,578 | $6,492,578 | ||
| Arts, Entertainment, & Recreation | $299 | 17 | N/A | 3,741 | 37.4 | 0.9% | 35.3 | $1,338,284 | $1,338,284 | ||
| Accommodation & Food Services | $271 | 15 | 2.8 | 27,643 | 276.4 | -4.6% | -1,276.9 | $16,508,336 | $16,508,336 | ||
| Other Services (exc. Public Admin.) | $355 | 18 | 6.0 | 8,277 | 82.8 | -1.7% | -143.7 | $5,207,430 | $5,207,430 | ||
| Public Administration | $340 | 15 | N/A | 23,738 | 237.4 | 2.9% | 679.0 | $5,229,106 | $5,229,106 | ||
| Nonclassified | $351 | 15 | N/A | ||||||||
| Total | $353 | 17 | 3.1 | 263,378 | 2,633.8 | -4.0% | $139,545,757 | $113,722,638 | -10,642.2 | $167,852,881 | $248,268,952 |
| Trust fund balance by the end of 2009 would be: | $85,415,514 | $4,999,443 | |||||||||
| aBased on 2011Q1 employment level, actual trust fund balance ending 2011Q1, and actual and projected UI tax and trust fund interest. | |||||||||||
| N/A - Not applicable because these industries had no net job losses but still had UI recipients. For those industries, the actual benefits of 2009 were used in all scenarios. | |||||||||||