
Labor Market Information > Wyoming Labor Force Trends > October 2011 > Detailed Covered Employment and Wages for First Quarter 2011: Modest Growth Continues
Detailed Covered Employment and Wages for First Quarter 2011: Modest Growth Continues
As in the two previous quarters, the largest job gains were found in the mining sector (including oil & gas). Partly because of continued job losses in construction, the state's overall growth rate did not accelerate, and in fact, remained modest in first quarter.
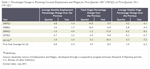 |
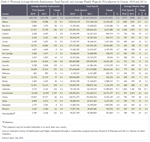
Total unemployment insurance (UI) covered payroll increased by $140.0 million (5.3%) in first quarter 2011. Employment rose by 2,652 jobs (1.0%) and average weekly wage increased by $33 (4.3%). These increases are similar to their five-year averages (see Table 1). The mining sector (including oil & gas) continued to be responsible for the largest number of new jobs and the greatest growth in payroll. UI covered payroll represents approximately 91% of all wage and salary disbursements and 43% of personal income in the state (U.S. Bureau of Economic Analysis, 2011). Analysts have noted that "minerals related employment is one of the key predictors of sales and use tax income" in Wyoming (CREG 2010).
The covered payroll and employment data in this article are tabulated by place of work, in contrast to the labor force estimates, which are a measure of employed and unemployed persons by place of residence. Also, the employment data presented in this article represent a count of jobs, not persons. When individuals work more than one job, each is counted separately. Finally, job growth (or decline) is stated in terms of net change. The Quarterly Turnover Statistics by Industry table presents alternative measures of job gains and losses.
The purpose of this article is to show employment and payroll changes between first quarter 2010 and first quarter 2011. These economic changes help gauge the overall strength of Wyoming's economy and identify the fastest and slowest growing sectors and geographic areas.
 |
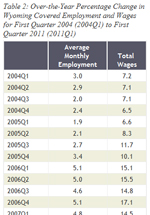 |
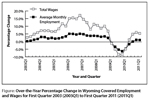
Payroll growth rebounded from the negative levels seen in 2009 and early 2010, and has remained near 5.0% in each of the past three quarters (see Figure). Job growth was positive in first quarter, but still well below levels which prevailed from 2004-2008 (see Table 2). In short, growth did not accelerate in first quarter, but rather remained quite modest by historical standards.
The mining sector (including oil & gas) expanded in first quarter, adding 2,171 jobs (9.0%) and $60.9 million (12.7%) in payroll.
Persistent job losses continued in the construction sector as employment fell by 1,687 jobs (-8.6%) and payroll decreased by $14.8 million (-7.0%).
Energy activity in the Niobrara Shale formation did not result in large numbers of new mining jobs in Laramie County. Instead, job growth showed up in Natrona County where many drilling companies and oil & gas field service firms are located.
Employment and Wages by County
 |
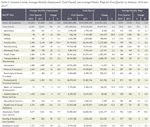
Employment increased in 15 counties and decreased in 8 counties (see Table 3). Total payroll rose in 21 counties and fell in 2 counties.
Sweetwater County gained 1,197 jobs (5.3%) and its total payroll grew by $34.2 million (12.3%). Mining (including oil & gas) added approximately 500 jobs, and smaller gains were seen in construction (approximately 150 jobs), transportation & warehousing (more than 100 jobs), administrative & waste services (approximately 100 jobs), and local government (approximately 100 jobs).
Fremont County's employment increased by 310 jobs (2.0%) and its total payroll grew by $10.8 million (7.9%). Job growth was seen in mining (including oil & gas; more than 100 jobs), professional & technical services (approximately 50 jobs), and accommodation & food services (approximately 50 jobs).
Sublette County added 224 jobs (4.4%) and its total payroll rose by $12.0 million (17.1%). Mining gained approximately 300 jobs, but employment decreased by nearly 150 jobs in construction.
Lincoln County's employment grew by 130 jobs (2.3%) and its total payroll increased by $6.7 million (12.3%). Job gains in construction (more than 250 jobs) were partially offset by job losses in retail trade and administrative & waste services.
Campbell County's employment fell by 246 jobs (-0.9%), but its total payroll increased by $6.6 million (1.8%). Large job losses in construction (nearly 800 jobs) were partially offset by job gains in mining (approximately 300 jobs), administrative & waste services (nearly 100 jobs), and other services (nearly 100 jobs).
Sheridan County lost 138 jobs (-1.1%) and its total payroll fell by $1.1 million (-1.0%). Employment decreased by more than 100 jobs in construction and also fell in retail trade and professional & technical services. Job growth was seen in health care & social assistance (more than 50 jobs).
Converse County's employment fell by 104 jobs (-1.9%), but its total payroll increased by $0.6 million (1.0%). Large job losses occurred in construction (more than 350 jobs), but employment grew in mining (including oil & gas; nearly 200 jobs).
 |
Natrona County (see Table 4) added 722 jobs (2.0%) and its total payroll rose by $38.3 million (10.2%). The largest job gains occurred in mining (including oil & gas; 673 jobs, or 23.7%), other services (174 jobs, or 10.8%), wholesale trade (110 jobs, or 4.8%), and manufacturing (93 jobs, or 6.0%). Job losses were seen in retail trade (-359 jobs, or -7.5%), professional & technical services (-71 jobs, or -5.0%), and construction (-70 jobs, or -2.9%).
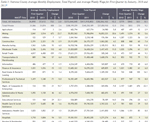 |
Laramie County (see Table 5) grew by 344 jobs (0.8%) and its total payroll increased by $10.2 million (2.6%). Transportation & warehousing reported the largest job gains (173 jobs, or 8.3%) followed by health care & social assistance (134 jobs, or 3.6%), and retail trade (81 jobs, or 1.6%). Employment decreased in construction (-248 jobs, or -10.1%) and professional & technical services (-123 jobs, or -7.6%).
Note: Due to space considerations, Tables 4 and 5 of the online version do not appear in the print version.
Statewide Employment and Wages by Industry
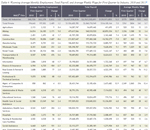 |
When viewed from an industry perspective, the largest job gains occurred in mining, health care & social assistance, transportation & warehousing, and administrative & waste services (see Table 6). Large job losses were seen in construction, retail trade, and finance & insurance.
Mining employment rose by 2,171 jobs (9.0%) and its total payroll increased by $60.9 million (12.7%). Support services for mining, which includes drilling services and oil & gas field services, added nearly 1,900 jobs. Mining, except oil & gas, added nearly 250 jobs.
Health care & social assistance added 561 jobs (2.4%) and its total payroll grew by $13.3 million (6.8%). Ambulatory health care services gained 284 jobs (3.3%), while social assistance gained 151 jobs (2.3%). More modest growth was seen in private hospitals (90 jobs, or 2.7%) and nursing & residential care facilities (36 jobs, or 0.8%).
Employment in transportation & warehousing increased by 476 jobs (5.6%) and its total payroll rose by $8.6 million (9.5%). Truck transportation added nearly 400 jobs, while warehousing & storage added nearly 100 jobs. Growth in trucking employment may be related to recent increases in oil & gas activity in the state.
Administrative & waste services grew by 473 jobs (7.8%) and its total payroll increased by $7.1 million (18.3%). Employment services (including temporary help agencies) added more than 350 jobs. Growth was also seen in waste management (approximately 100 jobs) and services to buildings & dwellings (more than 100 jobs).
Construction employment fell by 1,687 jobs (-8.6%) and its total payroll decreased by $14.8 million (-7.0%). Construction of buildings lost nearly 400 jobs, heavy & civil engineering construction lost nearly 850 jobs and specialty trade contractors lost approximately 450 jobs. It appears that the completion of the Ruby and Bison pipelines was one factor that negatively affected construction employment. A second possible factor could be the completion of infrastructure projects paid for with funds from the stimulus bill. Finally, building permits for single family homes peaked in 2007 and decreased rapidly in 2008 and 2009. Only about half as many building permits were issued in 2010 than in 2005, 2006, or 2007 (U.S. Census Bureau, 2011). Thus, construction employment in first quarter could also reflect a slowdown in homebuilding activity.
For 10 consecutive quarters construction employment has fallen, and at present appears to be a drag on overall growth in the state. As first quarter employment data suggests, growth in mining jobs is not always associated with growth in construction jobs. In fact, the linkage between mining and construction job growth may be complex and not well understood.
Retail trade employment decreased by 586 jobs (-2.0%), but its total payroll grew by $9.6 million (5.7%). Job losses were seen in many areas of retail, especially nonstore retailers (including catalog retailers, approximately 250 jobs), food & beverage stores (more than 200 jobs), and sporting goods, hobby, book, & music stores (approximately 150 jobs).
Finance & insurance lost 184 jobs (-2.7%), but its total payroll increased by $2.1 million (2.6%). Most of the job losses occurred in credit intermediation & related activities (approximately 150 jobs). Employment fell by approximately 50 jobs in insurance.
References
Consensus Revenue Estimating Group (CREG; 2010, October) Wyoming state government revenue forecast fiscal year 2011-fiscal year 2016. Retrieved February 17, 2011 from http://eadiv.state.wy.us/creg/GreenCREG_Oct10.pdf
U.S. Bureau of Economic Analysis. (2011, March 16). SA04 State income and employment summary -- Wyoming. Retrieved March 16, 2011, from http://www.bea.gov/regional/spi/default.cfm
U.S. Census Bureau. (2011, August 24). Housing Units Authorized by Building Permits. Retrieved August 31, 2011, from http://www.census.gov/construction/bps/