
Labor Market Information > Wyoming Labor Force Trends > October 2011 > 2011Q1 QCEW Tables and Figure
Quarterly Census of Employment and Wages
Tables and Figure for First Quarter 2011
See Related Article
| Year | Average Monthly Employment Percentage Change Over the Previous | Total Wages Percentage Change Over the Previous |
Average Weekly Wage Percentage Change Over the Previous |
|||
|---|---|---|---|---|---|---|
| Quarter | Year | Quarter | Year | Quarter | Year | |
| 2007Q1 | 4.8 | -1.4 | 14.5 | -5.5 | 9.2 | -4.1 |
| 2008Q1 | 3.6 | -1.7 | 10.6 | -6.0 | 6.8 | -4.4 |
| 2009Q1 | -1.0 | -4.9 | -1.2 | -13.0 | -0.2 | -8.5 |
| 2010Q1 | -4.7 | -3.2 | -4.9 | -9.8 | -0.3 | -6.7 |
| 2011Q1a | 1.0 | -3.4 | 5.3 | -10.4 | 4.3 | -7.2 |
| Five-Year Average for Q1 | 0.8 | -2.9 | 4.9 | -8.9 | 3.9 | -6.2 |
| aPreliminary. | ||||||
| Source: Quarterly Census of Employment and Wages, developed through a cooperative program between Research & Planning and the U.S. Bureau of Labor Statistics. | ||||||
| Extract date: July 2011. | ||||||
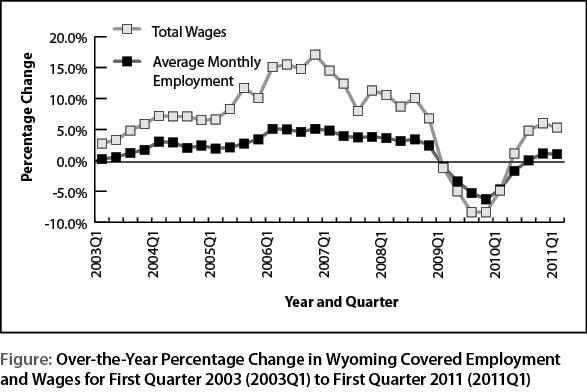
| Year and Quarter | Average Monthly Employment | Total Wages |
|---|---|---|
| 2004Q1 | 3.0 | 7.2 |
| 2004Q2 | 2.9 | 7.1 |
| 2004Q3 | 2.0 | 7.1 |
| 2004Q4 | 2.4 | 6.5 |
| 2005Q1 | 1.9 | 6.6 |
| 2005Q2 | 2.1 | 8.3 |
| 2005Q3 | 2.7 | 11.7 |
| 2005Q4 | 3.4 | 10.1 |
| 2006Q1 | 5.1 | 15.1 |
| 2006Q2 | 5.0 | 15.5 |
| 2006Q3 | 4.6 | 14.8 |
| 2006Q4 | 5.1 | 17.1 |
| 2007Q1 | 4.8 | 14.5 |
| 2007Q2 | 3.9 | 12.4 |
| 2007Q3 | 3.7 | 8.0 |
| 2007Q4 | 3.8 | 11.3 |
| 2008Q1 | 3.6 | 10.6 |
| 2008Q2 | 3.1 | 8.7 |
| 2008Q3 | 3.4 | 10.1 |
| 2008Q4 | 2.4 | 6.8 |
| 2009Q1 | -1.0 | -1.2 |
| 2009Q2 | -3.4 | -5.0 |
| 2009Q3 | -5.3 | -8.4 |
| 2009Q4 | -6.3 | -8.4 |
| 2010Q1 | -4.7 | -4.9 |
| 2010Q2 | -1.7 | 1.1 |
| 2010Q3 | 0.0 | 4.8 |
| 2010Q4 | 1.1 | 6.0 |
| 2011Q1a | 1.0 | 5.3 |
| aPreliminary. | ||
| Source: Quarterly Census of Employment and Wages, developed through a cooperative program between Research & Planning and the U.S. Bureau of Labor Statistics. | ||
| Extract date: July 2011. | ||
| County | Average Monthly Employment | Total Payroll | Average Weekly Wage | |||||||||
|---|---|---|---|---|---|---|---|---|---|---|---|---|
| First Quarter | Change | First Quarter | Change | First Quarter | Change | |||||||
| 2010 | 2011 | n | % | 2010 | 2011 | $ | % | 2010 | 2011 | $ | % | |
| Total | 260,726 | 263,378 | 2,652 | 1.0 | $2,627,558,836 | $2,767,530,691 | $139,971,855 | 5.3 | $775 | $808 | $33 | 4.3 |
| Albany | 15,028 | 15,008 | -20 | -0.1 | $128,516,135 | $131,681,422 | $3,165,287 | 2.5 | $658 | $675 | $17 | 2.6 |
| Big Horn | 3,884 | 3,970 | 86 | 2.2 | 31,218,426 | 33,428,832 | 2,210,406 | 7.1 | 618 | 648 | 30 | 4.9 |
| Campbell | 27,351 | 27,105 | -246 | -0.9 | 372,057,334 | 378,684,422 | 6,627,088 | 1.8 | 1,046 | 1,075 | 29 | 2.8 |
| Carbon | 6,428 | 6,429 | 1 | 0.0 | 61,464,590 | 62,361,324 | 896,734 | 1.5 | 736 | 746 | 10 | 1.4 |
| Converse | 5,396 | 5,292 | -104 | -1.9 | 55,218,749 | 55,787,920 | 569,171 | 1.0 | 787 | 811 | 24 | 3.0 |
| Crook | 2,189 | 2,201 | 12 | 0.5 | 17,335,747 | 18,346,931 | 1,011,184 | 5.8 | 609 | 641 | 32 | 5.3 |
| Fremont | 15,772 | 16,082 | 310 | 2.0 | 137,171,283 | 147,955,765 | 10,784,482 | 7.9 | 669 | 708 | 39 | 5.8 |
| Goshen | 4,457 | 4,465 | 8 | 0.2 | 31,565,202 | 33,672,697 | 2,107,495 | 6.7 | 545 | 580 | 35 | 6.4 |
| Hot Springs | 2,066 | 2,071 | 5 | 0.2 | 15,668,659 | 16,008,898 | 340,239 | 2.2 | 583 | 595 | 12 | 2.1 |
| Johnson | 3,013 | 3,057 | 44 | 1.5 | 22,723,036 | 22,743,572 | 20,536 | 0.1 | 580 | 572 | -8 | -1.4 |
| Laramie | 41,476 | 41,820 | 344 | 0.8 | 389,809,088 | 399,990,390 | 10,181,302 | 2.6 | 723 | 736 | 13 | 1.8 |
| Lincoln | 5,708 | 5,838 | 130 | 2.3 | 54,670,106 | 61,386,396 | 6,716,290 | 12.3 | 737 | 809 | 72 | 9.8 |
| Natrona | 36,890 | 37,612 | 722 | 2.0 | 373,644,640 | 411,910,802 | 38,266,162 | 10.2 | 779 | 842 | 63 | 8.1 |
| Niobrara | 862 | 850 | -12 | -1.4 | 6,118,312 | 6,321,085 | 202,773 | 3.3 | 546 | 572 | 26 | 4.8 |
| Park | 12,110 | 12,129 | 19 | 0.2 | 109,844,890 | 110,277,125 | 432,235 | 0.4 | 698 | 699 | 1 | 0.1 |
| Platte | 3,401 | 3,447 | 46 | 1.4 | 28,556,700 | 31,145,023 | 2,588,323 | 9.1 | 646 | 695 | 49 | 7.6 |
| Sheridan | 12,451 | 12,313 | -138 | -1.1 | 110,007,542 | 108,871,164 | -1,136,378 | -1.0 | 680 | 680 | 0 | 0.0 |
| Sublette | 5,119 | 5,343 | 224 | 4.4 | 70,118,354 | 82,104,229 | 11,985,875 | 17.1 | 1,054 | 1,182 | 128 | 12.1 |
| Sweetwater | 22,502 | 23,699 | 1,197 | 5.3 | 278,092,034 | 312,265,211 | 34,173,177 | 12.3 | 951 | 1,014 | 63 | 6.6 |
| Teton | 15,837 | 15,771 | -66 | -0.4 | 144,913,375 | 153,655,524 | 8,742,149 | 6.0 | 704 | 749 | 45 | 6.4 |
| Uinta | 8,800 | 8,723 | -77 | -0.9 | 90,288,924 | 87,811,569 | -2,477,355 | -2.7 | 789 | 774 | -15 | -1.9 |
| Washakie | 3,775 | 3,783 | 8 | 0.2 | 31,050,754 | 32,909,849 | 1,859,095 | 6.0 | 633 | 669 | 36 | 5.7 |
| Weston | 2,267 | 2,204 | -63 | -2.8 | 17,877,166 | 18,029,682 | 152,516 | 0.9 | 607 | 629 | 22 | 3.6 |
| Nonclassifiedb | 3,945 | 4,166 | 222 | 5.6 | 49,627,790 | 50,180,859 | 553,069 | 1.1 | 968 | 926 | -41 | -4.3 |
| aPreliminary. | ||||||||||||
| bThe employer may be located statewide or in more than one county. | ||||||||||||
| Source: Quarterly Census of Employment and Wages, developed through a cooperative program between Research & Planning and the U.S. Bureau of Labor Statistics. | ||||||||||||
| Extract date: July 2011. | ||||||||||||
(Note: Tables 4 and 5 of the online version do not appear in the print version.)
| Average Monthly Employment | Total Payroll | Average Weekly Wage | ||||||||||
|---|---|---|---|---|---|---|---|---|---|---|---|---|
| NAICSb Title | First Quarter | Change | First Quarter | Change | First Quarter | Change | ||||||
| 2010 | 2011 | n | % | 2010 | 2011 | $ | % | 2010 | 2011 | $ | % | |
| Total, All Industries | 36,890 | 37,612 | 722 | 2.0 | $373,644,640 | $411,910,802 | $38,266,162 | 10.2 | $779 | $842 | $63 | 8.1 |
| Total Private | 31,066 | 31,874 | 808 | 2.6 | $308,199,259 | $345,250,189 | $37,050,930 | 12.0 | $763 | $833 | $70 | 9.2 |
| Agriculture | 114 | 117 | 3 | 2.6 | 602,794 | 637,774 | 34,980 | 5.8 | 407 | 419 | 12 | 2.9 |
| Mining | 2,841 | 3,514 | 673 | 23.7 | 55,053,563 | 71,906,894 | 16,853,331 | 30.6 | 1,491 | 1,574 | 83 | 5.6 |
| Utilities | 122 | 129 | 7 | 5.7 | 2,041,964 | 2,218,148 | 176,184 | 8.6 | 1,287 | 1,323 | 36 | 2.8 |
| Construction | 2,391 | 2,321 | -70 | -2.9 | 25,111,895 | 26,175,177 | 1,063,282 | 4.2 | 808 | 868 | 60 | 7.4 |
| Manufacturing | 1,563 | 1,656 | 93 | 6.0 | 16,930,746 | 20,036,259 | 3,105,513 | 18.3 | 833 | 931 | 98 | 11.8 |
| Wholesale Trade | 2,306 | 2,416 | 110 | 4.8 | 31,020,809 | 34,438,224 | 3,417,415 | 11.0 | 1,035 | 1,096 | 61 | 5.9 |
| Retail Trade | 4,817 | 4,458 | -359 | -7.5 | 29,631,211 | 29,936,451 | 305,240 | 1.0 | 473 | 517 | 44 | 9.3 |
| Transportation & Warehousing | 889 | 946 | 57 | 6.4 | 9,858,072 | 11,458,448 | 1,600,376 | 16.2 | 853 | 932 | 79 | 9.3 |
| Information | 486 | 477 | -9 | -1.9 | 4,234,249 | 4,404,056 | 169,807 | 4.0 | 670 | 710 | 40 | 6.0 |
| Finance & Insurance | 1,031 | 1,016 | -15 | -1.5 | 13,685,361 | 14,295,220 | 609,859 | 4.5 | 1,021 | 1,082 | 61 | 6.0 |
| Real Estate & Rental & Leasing | 859 | 871 | 12 | 1.4 | 8,295,265 | 9,604,615 | 1,309,350 | 15.8 | 743 | 848 | 105 | 14.1 |
| Professional & Technical Services | 1,419 | 1,348 | -71 | -5.0 | 16,181,449 | 16,603,986 | 422,537 | 2.6 | 877 | 947 | 70 | 8.0 |
| Mgmt. of Companies & Enterprises | 134 | 155 | 21 | 15.7 | 3,757,074 | 3,388,018 | -369,056 | -9.8 | 2,157 | 1,681 | -476 | -22.1 |
| Administrative & Waste Services | 1,092 | 1,138 | 46 | 4.2 | 6,976,010 | 7,658,703 | 682,693 | 9.8 | 491 | 518 | 27 | 5.5 |
| Educational Services | 131 | 160 | 29 | 22.1 | 538,089 | 616,278 | 78,189 | 14.5 | 316 | 296 | -20 | -6.3 |
| Health Care & Social Assistance | 5,517 | 5,605 | 88 | 1.6 | 55,978,303 | 59,745,535 | 3,767,232 | 6.7 | 781 | 820 | 39 | 5.0 |
| Ambulatory Health Care Services | 1,825 | 1,852 | 27 | 1.5 | 25,289,691 | 27,701,541 | 2,411,850 | 9.5 | 1,066 | 1,151 | 85 | 8.0 |
| Hospitals | 1,710 | 1,804 | 94 | 5.5 | 19,181,931 | 20,453,205 | 1,271,274 | 6.6 | 863 | 872 | 9 | 1.0 |
| Nursing & Residential Care Facilities | 951 | 937 | -14 | -1.5 | 6,641,520 | 6,545,031 | -96,489 | -1.5 | 537 | 537 | 0 | 0.0 |
| Social assistance | 1,032 | 1,012 | -20 | -1.9 | 4,865,161 | 5,045,758 | 180,597 | 3.7 | 363 | 384 | 21 | 5.8 |
| Arts, Entertainment, & Recreation | 335 | 348 | 13 | 3.9 | 1,260,515 | 1,266,144 | 5,629 | 0.4 | 289 | 280 | -9 | -3.1 |
| Accommodation & Food Services | 3,407 | 3,414 | 7 | 0.2 | 12,347,001 | 12,520,388 | 173,387 | 1.4 | 279 | 282 | 3 | 1.1 |
| Other Services | 1,612 | 1,786 | 174 | 10.8 | 14,694,889 | 18,339,871 | 3,644,982 | 24.8 | 701 | 790 | 89 | 12.7 |
| Total Government | 5,824 | 5,737 | -87 | -1.5 | $65,445,381 | $66,660,613 | $1,215,232 | 1.9 | $864 | $894 | $30 | 3.5 |
| Federal Government | 750 | 687 | -63 | -8.4 | 10,909,013 | 10,713,825 | -195,188 | -1.8 | 1,119 | 1,200 | 81 | 7.2 |
| State Government | 682 | 693 | 11 | 1.6 | 8,956,788 | 9,241,458 | 284,670 | 3.2 | 1,010 | 1,026 | 16 | 1.6 |
| Local Government | 4,392 | 4,357 | -35 | -0.8 | 45,579,580 | 46,705,330 | 1,125,750 | 2.5 | 798 | 825 | 27 | 3.4 |
| Local Government Education | ND | ND | ND | ND | ND | ND | ND | ND | ND | ND | ND | ND |
| aPreliminary. | ||||||||||||
| bNorth American Industry Classification System. | ||||||||||||
| ND-Not disclosable due to confidentiality of information. | ||||||||||||
| Source: Quarterly Census of Employment and Wages, developed through a cooperative program between Research & Planning and the U.S. Bureau of Labor Statistics. | ||||||||||||
| Extract date: July 2011. | ||||||||||||
| Average Monthly Employment | Total Payroll | Average Weekly Wage | ||||||||||
|---|---|---|---|---|---|---|---|---|---|---|---|---|
| NAICSb Title | First Quarter | Change | First Quarter | Change | First Quarter | Change | ||||||
| 2010 | 2011 | n | % | 2010 | 2011 | $ | % | 2010 | 2011 | $ | % | |
| Total, All Industries | 41,476 | 41,820 | 344 | 0.8 | $389,809,088 | $399,990,390 | $10,181,302 | 2.6 | $723 | $736 | $13 | 1.8 |
| Total Private | 27,853 | 28,037 | 184 | 0.7 | $223,800,632 | $233,638,565 | $9,837,933 | 4.4 | $618 | $641 | $23 | 3.7 |
| Agriculture | 270 | 261 | -9 | -3.3 | 1,798,540 | 1,790,160 | -8,380 | -0.5 | 512 | 528 | 16 | 3.1 |
| Mining | 48 | 82 | 34 | 70.8 | 706,746 | 1,122,085 | 415,339 | 58.8 | 1,133 | 1,053 | -80 | -7.1 |
| Utilities | 132 | 139 | 7 | 5.3 | 2,635,386 | 2,824,082 | 188,696 | 7.2 | 1,536 | 1,563 | 27 | 1.8 |
| Construction | 2,466 | 2,218 | -248 | -10.1 | 22,719,870 | 20,346,590 | -2,373,280 | -10.4 | 709 | 706 | -3 | -0.4 |
| Manufacturing | 1,408 | 1,441 | 33 | 2.3 | 19,930,708 | 19,313,453 | -617,255 | -3.1 | 1,089 | 1,031 | -58 | -5.3 |
| Wholesale Trade | 808 | 798 | -10 | -1.2 | 9,581,978 | 9,794,169 | 212,191 | 2.2 | 912 | 944 | 32 | 3.5 |
| Retail Trade | 5,089 | 5,170 | 81 | 1.6 | 30,147,662 | 32,729,741 | 2,582,079 | 8.6 | 456 | 487 | 31 | 6.8 |
| Transportation & Warehousing | 2,083 | 2,256 | 173 | 8.3 | 18,947,889 | 22,556,638 | 3,608,749 | 19.0 | 700 | 769 | 69 | 9.9 |
| Information | 1,090 | 1,080 | -10 | -0.9 | 10,903,605 | 10,935,144 | 31,539 | 0.3 | 769 | 779 | 10 | 1.3 |
| Finance & Insurance | 1,661 | 1,647 | -14 | -0.8 | 18,511,791 | 19,278,823 | 767,032 | 4.1 | 857 | 900 | 43 | 5.0 |
| Real Estate & Rental & Leasing | 471 | 484 | 13 | 2.8 | 4,094,880 | 4,300,195 | 205,315 | 5.0 | 669 | 683 | 14 | 2.1 |
| Professional & Technical Services | 1,616 | 1,493 | -123 | -7.6 | 18,299,492 | 17,487,536 | -811,956 | -4.4 | 871 | 901 | 30 | 3.4 |
| Mgmt. of Companies & Enterprises | 73 | 77 | 4 | 5.5 | 1,176,061 | 1,304,314 | 128,253 | 10.9 | 1,239 | 1,303 | 64 | 5.2 |
| Administrative & Waste Services | 1,436 | 1,440 | 4 | 0.3 | 8,208,783 | 8,239,329 | 30,546 | 0.4 | 440 | 440 | 0 | 0.0 |
| Educational Services | 218 | 224 | 6 | 2.8 | 1,364,213 | 1,358,723 | -5,490 | -0.4 | 481 | 467 | -14 | -2.9 |
| Health Care & Social Assistance | 3,753 | 3,887 | 134 | 3.6 | 32,554,448 | 36,741,817 | 4,187,369 | 12.9 | 667 | 727 | 60 | 9.0 |
| Ambulatory Health Care Services | 1,671 | 1,833 | 162 | 9.7 | 20,458,384 | 24,800,763 | 4,342,379 | 21.2 | 942 | 1,041 | 99 | 10.5 |
| Nursing & Residential Care Facilties | 908 | 863 | -45 | -5.0 | 6,101,768 | 5,836,603 | -265,165 | -4.3 | 517 | 520 | 3 | 0.6 |
| Hospitals & Social Assistance | 1,173 | 1,191 | 18 | 1.5 | 5,994,296 | 6,104,451 | 110,155 | 1.8 | 393 | 394 | 1 | 0.3 |
| Arts, Entertainment, & Recreation | 262 | 262 | 0 | 0.0 | 763,018 | 789,935 | 26,917 | 3.5 | 224 | 232 | 8 | 3.6 |
| Accommodation & Food Services | 3,773 | 3,842 | 69 | 1.8 | 13,200,961 | 13,873,192 | 672,231 | 5.1 | 269 | 278 | 9 | 3.3 |
| Other Services | 1,196 | 1,234 | 38 | 3.2 | 8,254,601 | 8,852,639 | 598,038 | 7.2 | 531 | 552 | 21 | 4.0 |
| Total Government | 13,623 | 13,783 | 160 | 1.2 | $166,008,456 | $166,351,825 | $343,369 | 0.2 | $937 | $928 | -$9 | -1.0 |
| Federal Government | 2,579 | 2,650 | 71 | 2.8 | 38,025,761 | 37,853,735 | -172,026 | -0.5 | 1,134 | 1,099 | -35 | -3.1 |
| State Government | 4,043 | 4,080 | 37 | 0.9 | 56,543,469 | 57,053,959 | 510,490 | 0.9 | 1,076 | 1,076 | 0 | 0.0 |
| Local Government | 7,001 | 7,053 | 52 | 0.7 | 71,439,226 | 71,444,131 | 4,905 | 0.0 | 785 | 779 | -6 | -0.8 |
| Local Government Education | 3,697 | 3,806 | 109 | 3.0 | 36,448,144 | 37,080,841 | 632,697 | 1.7 | 758 | 749 | -9 | -1.2 |
| aPreliminary. | ||||||||||||
| bNorth American Industry Classification System. | ||||||||||||
| Source: Quarterly Census of Employment and Wages, developed through a cooperative program between Research & Planning and the U.S. Bureau of Labor Statistics. | ||||||||||||
| Extract date: July 2011. | ||||||||||||
| NAICSb Title | Average Monthly Employment | Total Payroll | Average Weekly Wage | |||||||||
|---|---|---|---|---|---|---|---|---|---|---|---|---|
| First Quarter | Change | First Quarter | Change | First Quarter | Change | |||||||
| 2010 | 2011 | n | % | 2010 | 2011 | $ | % | 2010 | 2011 | $ | % | |
| Total, All Industries | 260,726 | 263,378 | 2,652 | 1.0 | $2,627,558,836 | $2,767,530,691 | $139,971,855 | 5.3 | $775 | $808 | $33 | 4.3 |
| Total Private | 194,643 | 197,052 | 2,409 | 1.2 | $1,926,605,785 | $2,060,710,949 | $134,105,164 | 7.0 | $761 | $804 | $43 | 5.7 |
| Agriculture | 2,113 | 2,122 | 9 | 0.4 | 14,287,747 | 14,699,442 | 411,695 | 2.9 | 520 | 533 | 13 | 2.5 |
| Mining | 24,014 | 26,185 | 2,171 | 9.0 | 479,617,566 | 540,510,920 | 60,893,354 | 12.7 | 1,536 | 1,588 | 52 | 3.4 |
| Utilities | 2,451 | 2,493 | 42 | 1.7 | 42,707,358 | 45,870,826 | 3,163,468 | 7.4 | 1,340 | 1,415 | 75 | 5.6 |
| Construction | 19,693 | 18,006 | -1,687 | -8.6 | 211,827,647 | 197,065,368 | -14,762,279 | -7.0 | 827 | 842 | 15 | 1.8 |
| Manufacturing | 8,479 | 8,701 | 222 | 2.6 | 106,849,963 | 115,735,720 | 8,885,757 | 8.3 | 969 | 1,023 | 54 | 5.6 |
| Wholesale Trade | 8,351 | 8,602 | 251 | 3.0 | 105,398,787 | 115,027,281 | 9,628,494 | 9.1 | 971 | 1,029 | 58 | 6.0 |
| Retail Trade | 28,740 | 28,154 | -586 | -2.0 | 168,056,785 | 177,689,132 | 9,632,347 | 5.7 | 450 | 485 | 35 | 7.8 |
| Transportation & Warehousing | 8,507 | 8,983 | 476 | 5.6 | 90,689,852 | 99,314,485 | 8,624,633 | 9.5 | 820 | 850 | 30 | 3.7 |
| Information | 3,886 | 3,818 | -68 | -1.7 | 35,198,820 | 36,921,088 | 1,722,268 | 4.9 | 697 | 744 | 47 | 6.7 |
| Finance & Insurance | 6,904 | 6,720 | -184 | -2.7 | 82,335,008 | 84,478,777 | 2,143,769 | 2.6 | 917 | 967 | 50 | 5.5 |
| Real Estate & Rental & Leasing | 3,808 | 3,885 | 77 | 2.0 | 33,515,328 | 38,037,723 | 4,522,395 | 13.5 | 677 | 753 | 76 | 11.2 |
| Professional & Technical Services | 9,070 | 8,982 | -88 | -1.0 | 107,452,689 | 112,394,675 | 4,941,986 | 4.6 | 911 | 963 | 52 | 5.7 |
| Mgmt. of Companies & Enterprises | 858 | 862 | 4 | 0.5 | 28,431,744 | 32,105,426 | 3,673,682 | 12.9 | 2,549 | 2,865 | 316 | 12.4 |
| Administrative & Waste Services | 6,045 | 6,518 | 473 | 7.8 | 38,791,376 | 45,905,408 | 7,114,032 | 18.3 | 494 | 542 | 48 | 9.7 |
| Educational Services | 1,568 | 1,644 | 76 | 4.8 | 10,114,783 | 10,834,499 | 719,716 | 7.1 | 496 | 507 | 11 | 2.2 |
| Health Care & Social Assistance | 22,988 | 23,549 | 561 | 2.4 | 197,509,032 | 210,845,033 | 13,336,001 | 6.8 | 661 | 689 | 28 | 4.2 |
| Ambulatory Health Care Services | 8,543 | 8,827 | 284 | 3.3 | 100,020,192 | 109,037,094 | 9,016,902 | 9.0 | 901 | 950 | 49 | 5.4 |
| Hospitals | 3,283 | 3,373 | 90 | 2.7 | 35,727,085 | 37,735,582 | 2,008,497 | 5.6 | 837 | 861 | 24 | 2.9 |
| Nursing & Residential Care Facilities | 4,502 | 4,538 | 36 | 0.8 | 29,648,478 | 30,687,176 | 1,038,698 | 3.5 | 507 | 520 | 13 | 2.6 |
| Social Assistance | 6,660 | 6,811 | 151 | 2.3 | 32,113,277 | 33,385,181 | 1,271,904 | 4.0 | 371 | 377 | 6 | 1.6 |
| Arts, Entertainment, & Recreation | 2,300 | 2,345 | 45 | 2.0 | 9,682,987 | 9,687,246 | 4,259 | 0.0 | 324 | 318 | -6 | -1.9 |
| Accommodation & Food Services | 27,238 | 27,554 | 316 | 1.2 | 106,411,686 | 109,776,807 | 3,365,121 | 3.2 | 301 | 306 | 5 | 1.7 |
| Other Services | 7,628 | 7,928 | 300 | 3.9 | 57,726,627 | 63,811,093 | 6,084,466 | 10.5 | 582 | 619 | 37 | 6.4 |
| Total Government | 66,084 | 66,326 | 242 | 0.4 | $700,953,051 | $706,819,742 | $5,866,691 | 0.8 | $816 | $820 | $4 | 0.5 |
| Federal Government | 7,368 | 7,212 | -156 | -2.1 | 101,126,290 | 98,387,438 | -2,738,852 | -2.7 | 1,056 | 1,049 | -7 | -0.7 |
| State Government | 13,172 | 13,278 | 106 | 0.8 | 166,672,553 | 169,511,804 | 2,839,251 | 1.7 | 973 | 982 | 9 | 0.9 |
| State Government Education | 3,565 | 3,587 | 22 | 0.6 | 44,552,016 | 44,691,141 | 139,125 | 0.3 | 961 | 958 | -3 | -0.3 |
| Local Government | 45,543 | 45,836 | 293 | 0.6 | 433,154,208 | 438,920,500 | 5,766,292 | 1.3 | 732 | 737 | 5 | 0.7 |
| Local Government Education | 24,203 | 24,542 | 340 | 1.4 | 227,676,941 | 230,101,693 | 2,424,752 | 1.1 | 724 | 721 | -2 | -0.3 |
| Hospitals | 6,517 | 6,515 | -2 | 0.0 | 72,451,152 | 74,976,952 | 2,525,800 | 3.5 | 855 | 885 | 30 | 3.5 |
| aPreliminary. | ||||||||||||
| bNorth American Industry Classification System. | ||||||||||||
| Source: Quarterly Census of Employment and Wages, developed through a cooperative program between Research & Planning and the U.S. Bureau of Labor Statistics. | ||||||||||||
| Extract date: July 2011. | ||||||||||||