Health Care and Retail Sales Top Occupational Employment in Wyoming by Industry
Of 25 occupations in Wyoming with the largest employment in May 2012, the top two were in the retail trade sector: retail salespersons and cashiers had employment of 7,360 and 5,340, respectively. The industry sector with the greatest employment was health care and social assistance (31,000) with a mean hourly wage of $22.31.
Related Tables and Figures
Continue Reading →
Also inside August Trends:
Wyoming Occupational Fatalities Increase Slightly in 2012
The number of occupational fatalities in Wyoming rose from 32 in 2011 to 35 in 2012, an increase of 3 deaths (9.4%; see Figure). On average, from 1992-2012 there were 34 occupational fatalities each year. In 2012, the largest number of deaths occurred in trade, transportation, & utilities (12, or 34.3% of all deaths; see Table). Within that category, 10 deaths were in transportation & warehousing (28.6%). Natural resources & mining accounted for 10 deaths (28.6%), of which seven were in agriculture (20.0%) and three in mining (8.6%). Three deaths ocurred in construction (8.6%) and three in government (8.6%). Nearly half (48.6%) of workplace fatalities were the result of transportation incidents.
Continue Reading →
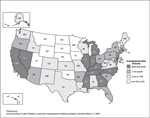
Map: Seasonally Adjusted Unemployment Rates, June 2013
Wyoming Lags Behind Surrounding States in Job Growth
 |
Before the Great Recession, Wyoming’s job growth was generally higher than its neighboring states. During 2008, high oil and natural gas prices spurred energy development in Wyoming, while holding back economic growth in the nation as a whole. During the recession, a sharp drop in energy prices caused larger job losses in Wyoming than were seen in most neighboring states. Wyoming added jobs at a healthy pace early in the recovery, but in the second half of 2012 job growth slowed to very low levels.
Continue Reading →
Wyoming Unemployment Rate Unchanged at 4.6% in June 2013
Wyoming's seasonally adjusted unemployment rate was unchanged at 4.6% (or an estimated 14,086 individuals) in June. It remained significantly lower than both its June 2012 level (5.5%; or an estimated 16,984 individuals) and the current U.S. unemployment rate (7.6%). Seasonally adjusted employment of Wyoming residents grew modestly, rising by 359 individuals (0.1%) from May to June. Most county unemployment rates increased slightly from May to June. Unemployment sometimes rises in June as large numbers of young people leave school and join the labor force.
Continue Reading →
Table of Contents
- PDF Version
- Credits
- Health Care and Retail Sales Top Occupational Employment in Wyoming by Industry
- Wyoming Occupational Fatalities Increase Slightly in 2012
- Map: Seasonally Adjusted Unemployment Rates, June 2013
- Wyoming Lags Behind Surrounding States in Job Growth
- Wyoming Unemployment Rate Unchanged at 4.6% in June 2013
- Current Employment Statistics (CES) Estimates and Research & Planning's Short-Term Projections, June 2013
- Wyoming Nonagricultural Wage and Salary Employment
- Campbell County
- Sweetwater County
- Teton County
- Nonagricultural Employment Growth Graph

- Nonagricultural Wage and Salary Employment Graph

- Economic Indicators
- Wyoming Total Nonfarm Employment
- Selected U.S. Employment Data
- Multiple Jobholders
- Discouraged Workers
- Part-Time for Economic Reasons
- Consumer Price Index
- Wyoming Building Permits
- Baker Hughes Rig Count

- Wyoming County Unemployment Rates
- Wyoming Normalized Unemployment Insurance Statistics: Initial Claims
- Statewide
- Laramie County
- Natrona County
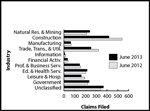
- Statewide by Industry Graph
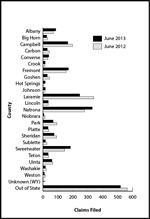
- Statewide by County Graph
- Wyoming Normalized Unemployment Insurance Statistics: Continued Claims
- Statewide
- Laramie County
- Natrona County
- Statewide by Industry Graph
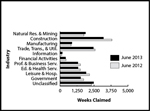
- Statewide by County Graph
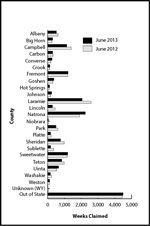
- Map of Wyoming Regions, Counties, and County Seats with County Unemployment Rates


