How it Works and Why it Matters
 |
Wyoming employers have historically relied upon resident youths and nonresident workers to some degree, often to fill low-paying, seasonal jobs. Since 2000, the number of employed resident youths has decreased, and the number of employed nonresidents has increased. Are nonresidents displacing resident youths in Wyoming's workforce, or are Wyoming employers turning to nonresidents after exhausting the supply of resident youths? What potential consequences do these trends bring? This three-part series of articles addresses those questions by presenting definitions of resident youth workers and nonresident workers and examining the changing roles of those segments of the workforce.
Related Tables and Figures
Continue Reading →
Also inside June Trends:
Wyoming Mass Layoffs Fall Slightly in 2012
 |
The number of mass layoffs in Wyoming fell from 10 in 2011 to nine in 2012 (see Table). Mass layoffs have decreased for the past three years after peaking at 13 in 2009. This downward trend in mass layoffs is consistent with Wyoming's falling unemployment rate, which peaked at 7.0% in 2010 and has been steadily decreasing since then. Despite the recent decreases, the number of mass layoffs remains higher than before the recession.
Continue Reading →
BLS Discontinues Mass Layoff Statistics Program
As part of the federal automatic budget cuts known as sequestration, the U.S. Bureau of Labor Statistics (BLS) was required to cut its budget by more than $30 million. In order to absorb part of this budget cut, one of the programs the BLS eliminated was Mass Layoff Statistics (MLS). As of June 30, MLS data are no longer collected, analyzed, or published for Wyoming or the United States.
Wyoming Unemployment Rate Falls to 4.8% in April 2013
The Research & Planning section of the Wyoming Department of Workforce Services has reported that the state's seasonally adjusteda unemployment fell from 4.9% in March to 4.8% in April. Wyoming's unemployment rate remained significantly lower than the U.S. rate of 7.5%. Seasonally adjusted employment of Wyoming residents decreased slightly, falling by 218 individuals (-0.1%) from March to April.
Continue Reading →
Table of Contents
- PDF Version
- Credits
- Youths and Nonresidents in Wyoming's Labor Force, Part 1: How it Works and Why it Matters
- Wyoming Mass Layoffs Fall Slightly in 2012
- BLS Discontinues Mass Layoff Statistics Program
- Wyoming Unemployment Rate Falls to 4.8% in April 2013
- Current Employment Statistics (CES) Estimates and Research & Planning's Short-Term Projections, April 2012
- Wyoming Nonagricultural Wage and Salary Employment
- Campbell County
- Sweetwater County
- Teton County
- Nonagricultural Employment Growth Graph

- Nonagricultural Wage and Salary Employment Graph

- Economic Indicators
- Wyoming Total Nonfarm Employment
- Selected U.S. Employment Data
- Multiple Jobholders
- Discouraged Workers
- Part-Time for Economic Reasons
- Consumer Price Index
- Wyoming Building Permits
- Baker Hughes Rig Count

- Wyoming County Unemployment Rates
- Wyoming Normalized Unemployment Insurance Statistics: Initial Claims
- Statewide
- Laramie County
- Natrona County
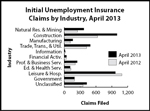
- Statewide by Industry Graph
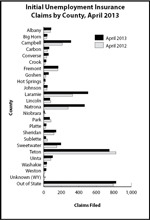
- Statewide by County Graph
- Wyoming Normalized Unemployment Insurance Statistics: Continued Claims
- Statewide
- Laramie County
- Natrona County
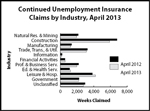
- Statewide by Industry Graph
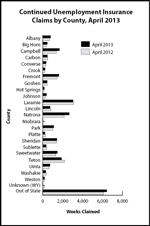
- Statewide by County Graph
- Map of Wyoming Regions, Counties, and County Seats with County Unemployment Rates

