
Wyoming Benefits Survey 2011
excerpted from: http://doe.state.wy.us/LMI/benefits2011/benefits_2011.pdf
See Related Tables and Figures
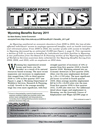
As Wyoming weathered an economic downturn from 2009 to 2010, the loss of jobs affected individuals’ access to employer-sponsored benefits, such as health insurance and retirement plans. From 2008 to 2010, the number of jobs with access to benefits in Wyoming decreased by an estimated 15,268 (see Figure 1). This represents a decline of 5.6% in access to benefits for individuals and their families in Wyoming. A new publication from the Research & Planning section of the Wyoming Department of Workforce Services examines data collected for the Wyoming Benefits Survey from 2008, 2009, and 2010, with an emphasis on 2010 data.
 |
 |
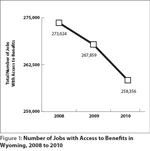
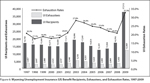
Wyoming has experienced several booms and busts over the decades1 as a result of its natural resources-based economy. The most recent expansion saw increases in employment that ranged from 3.9% in third quarter 2006 to 4.8% in first quarter 2007 (see Figure 2; Wyoming Department of Workforce Services, Research & Planning, n.d.[a]). Growth in the average monthly wage was even more significant, with four straight quarters of increases of 10% or greater from first quarter 2006 to fourth quarter 2006. Wyoming entered into an economic downturn in first quarter 2009, when over-the-year employment declined by 1.0% (-2,700 jobs). The most significant job losses occurred in fourth quarter 2009, when average monthly employment fell by 6.3% (-18,000 jobs) over the year. From first quarter 2008 to first quarter 2010, 15,469 jobs were lost. For additional detail about wages and employment in Wyoming, see the Quarterly Census of Employment and Wages (QCEW) page at http://doe.state.wy.us/LMI/toc_202.htm.
The loss of jobs affected individuals’ access to employer-sponsored benefits, specifically health insurance and retirement plans. From 2008 to 2010 nearly 15,000 full-time workers in Wyoming lost access to health insurance, an 8.9% decrease. Just over 19,000 workers (-11.7%) lost access to retirement plans. Overall, 18,216 full-time workers lost access to any benefit.
The Wyoming Benefits Survey 2011 serves several purposes. First, it allows changes in benefits offerings to be measured over time using a standardized methodology. It also allows for a way to measure trends in which types of employers offer benefits and to which types of jobs – full- or part-time – benefits are offered. Finally, it can be used for research and policy analysis purposes (Levi & Wiatrowski, 2001). The full methodology of this survey can be found online at http://doe.state.wy.us/LMI/benefits2011/benefits_2011.pdf.
Recent Economic Conditions
Job loss impacts individuals’ and families’ financial security (“10 Firms,” 2010). In most cases, less money is available to pay for health care services and to save for retirement. When income declines, the loss of employer-sponsored health insurance may cause some people to forego health services. However, as a proportion of personal income, the percentage of income devoted to health care tends to rise. For example, from 2008 to 2009, the percentage of income going towards health care rose from 6.0% to 6.2% (Catlin, Lassman, Martin, & Whittle, 2011).
The Great Recession (2007-2009) in the U.S. began in December 2007, and it was the most severe recession since the end of World War II. From October 2008 through March 2009, monthly job losses averaged 712,000, marking it as the largest six-month period of job losses since 1945 (Goodman & Mance, 2011). As of March 2010, the U.S. economy needed 10.6 million new jobs to get back to the unemployment rate that existed prior to the start of the recession (Katz, 2010). As a result of declining employment and incomes, approximately 5 million Americans lost their employer-based health insurance (Holahan, 2010).
Unemployment in Wyoming
|
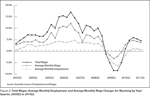
Wyoming’s seasonally adjusted unemployment rate fell from August 2010 to November 2010, while the U.S. unemployment rate increased (see Figure 3). In January 2010, the Wyoming unemployment rate peaked at 7.6%, while the U.S. rate was 9.7%. By the end of 2010, Wyoming’s unemployment rate declined to 6.4% and the U.S. rate had dropped only slightly to 9.4% (Wyoming Department of Employment, Research & Planning, 2011).
The effects of the national recession on Wyoming employment were not evident until first quarter 2009 when employment declined by 1.0% (see Figure 1). This was the first of six straight quarters of declining employment. Employment stabilized in third quarter 2010, and growth remained positive throughout the remainder of 2010 and into second quarter 2011, albeit at levels significantly lower than prior to first quarter 2009. For example, in first quarter 2011, employment grew at 1.1% over the year, compared to 3.5% in first quarter 2008.
Wyoming Unemployment Insurance Claims
|
 |
 |
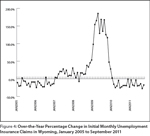
An increase in Unemployment Insurance (UI) claims activity coincided with the economic downturn in Wyoming. Late 2008 saw the beginning of significant increases in initial UI claims (see Figure 4; Wyoming Department of Workforce Services, Research & Planning, n.d.[b]), the number of weeks of benefits claimed, or continued claims (see Figure 5), and the number and percentage of individuals who exhausted their UI benefits (see Figure 6). From October 2007 to October 2008, the number of initial claims increased from 2,026 to 2,705 (38.2%). The number of initial claims spiked in December 2009 at 5,975. However, the over-the-year percentage change was highest in May 2009, when claims rose by 185.6% from May 2008. The number of claims began to fall in January 2010, and by September 2011, initial claims declined to 2,236.
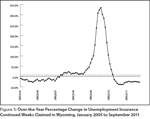
As more people were filing initial claims, the number of weeks of benefits claimed also rose (see Figure 5; Wyoming Department of Workforce Services, Research & Planning, n.d.[b]). The number of weeks of benefits claimed was greatest in January 2010, when 53,920 continued weeks were claimed. In September 2011, the number of weeks claimed fell to 16,443, which was more consistent with what had been seen prior to the state’s economic downturn. The largest over-the-year percentage increase in the number of weeks claimed occurred in July 2009 (334.4%). As of September 2011, the number of weeks claimed decreased by 27.5% over the year.
The number and percentage of individuals who exhausted their UI benefits rose significantly from 2008 to 2009 (see Figure 6; Wen 2010). In 2008 there were 3,450 individuals who exhausted their benefits and the exhaustion rate was 20.4%. By 2009 the number rose to 12,069 and the rate had risen to 32.3%. For additional information about UI claims, go to R&P’s Unemployment Insurance Statistics page at http://doe.state.wy.us/LMI/ui.htm.
Impact of Job Loss on Employer-Sponsored Benefits in Wyoming
|
|
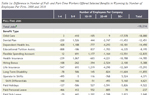
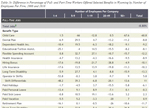
From 2008 to 2010, the net change in the estimated number of workers offered benefits was -15,268 (see Table 1a). This represents a decline of 5.6% in access to benefits for individuals and their families (see Table 1b). Full-time workers were affected more than part-time workers by decreases, with 18,216 fewer full-time workers offered any of the selected benefits, while the proportion offered benefits declined by 8.8%. The number of full-time workers offered health insurance fell by 14,785 (-8.9%), while full-time workers offered dependent health insurance and retirement plans fell by 14,490 (-9.2%) and 19,240 (-11.7%), respectively. The number of full-time workers offered shift differentials increased by 4,621 (11.0%), while the number offered paid sick leave increased by 2,040 (2.3%). The number of full-time workers offered paid vacation also increased (1,366, or 0.9%).
While the number of full-time workers offered benefits declined, the number of part-time workers offered benefits rose by 2,948 (4.5%; see Tables 1a and 1b). It may be that some individuals who were originally full-time were changed to part-time status by existing employers. These employers may have continued to provide benefits on some level to these workers, which could help explain the rise in the number of part-time workers offered benefits. The number of part-time workers offered health insurance increased by 1,374 in 2010 from 2008 (21.3%). The number of part-time workers offered dependent health insurance grew by 1,810 (34.7%). However, the number of workers offered retirement plans fell by 2,538 (-11.7%).
Wyoming Medicaid Enrollment
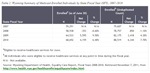 |
Table 2 illustrates changes in Wyoming Medicaid enrollment for state fiscal years 2007 to 20102. From fiscal year 2007 to fiscal year 2008 the number of people enrolled in Wyoming Medicaid (unduplicated count) declined by 850. Over the following two years, the number of enrolled individuals increased by 3,418 in 2009 and 6,344 in 2010. While some of the increase in Medicaid enrollment may be a result of job losses, R&P will not be able to definitively determine how much job loss plays a role until administrative data from Wyoming Wage Records, UI claims activity, and Medicaid enrollment data can be linked together.
Benefits Survey
Of the 2,712 employers who received a questionnaire, 2,050 (75.6%) completed and returned them. There were 52 employers (1.9%) who refused to participate, 40 (1.5%) who were temporarily closed, 73 (2.7%) who were permanently out of business, 64 (2.4%) with insufficient address information, and 103 (3.8%) who reported zero employees during the survey reference period. Refusals, employers who were out of business, had no employees, or could not be contacted were removed from the initial number of questionnaires sent out because no valid data could be obtained. This left a net total of 2,380 useable questionnaires and an overall net useable response rate of 86.1% (completed questionnaires/net useable questionnaires). During the four quarters of 2010, the net useable response rate ranged from a low of 82.8% in the first quarter to a high of 91.5% in the second quarter.
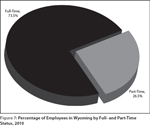
The U.S. Department of Labor, Bureau of Labor Statistics (BLS) defines full-time employees as anyone working 35 hours or more in a week; anyone working fewer than 35 hours is defined as part-time. However, for purposes of this survey, full- and part-time status are not defined by the BLS standard; rather the questionnaire asks employers for their definition of part-time. In 2010, just under three-fourths of Wyoming jobs (73.5%; see Figure 7) were full-time while the rest (26.5%) were part-time.
 |
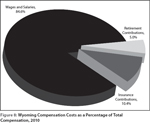 |
Total compensation refers to the amount of money an employer spends on wages combined with the amount spent on benefits. Contributions to insurance plans and retirement plans represent the majority of compensation other than wages. In Wyoming during 2010, 5.0% of total compensation consisted of contributions to defined-benefit and defined-contribution retirement plans and 10.4% went to medical, dental, and vision insurance plans (see Figure 8).
|
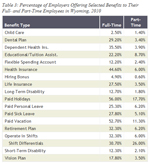
Wyoming Benefits Survey 2011 examines the proportion of employers who offered selected benefits to their employees by full- and part-time status (see Table 3). Paid holidays (56.0%) and paid vacation (52.7%) were the benefits offered most often by employers to their full-time employees. An estimated 44.6% of employers offered health insurance to full-time workers and 32.3% offered retirement benefits. In comparison, the benefits employers most often offered to part-time workers were shift differentials (26.0%), paid holidays (17.7%), and paid vacation (11.3%). Only 6.0% of employers offered health insurance to part-time workers and 6.2% offered retirement plans.
The number and proportion of workers offered benefits varied widely by firm size. More workers in firms with 50 or more employees were offered all benefits than those in smaller firms. This was also true for individual benefits. For example, 103,242 full-time workers (92.5%) in firms with 50 or more employees were offered health insurance compared to 4,791 full-time workers (36.2%) working for firms with 1-4 employees. Of the 145,131 full-time workers offered retirement plans, 102,894 (70.9%) of them worked for the state’s largest employers.
The number and percentage of all workers offered health insurance varied widely by industry. In the natural resources & mining industry, for example, 92.7% (23,366) of workers were offered health insurance. In the educational & health services industry an estimated 41,596 workers (75.1%) were offered health insurance. In the leisure & hospitality industry, only 6,769 workers (27.5%) were offered health insurance.
Wyoming Benefits Survey 2011 excludes data analysis pertaining to specific occupations offered benefits. However, information about selected benefits offered at the occupational level are available from R&P’s New Hires page at http://doe.state.wy.us/LMI/newhires.htm. There is wide variation among occupations offered benefits. For example, of educational, vocational, & school counselors, 100.0% of workers were offered both health insurance and a retirement plan, and 62.5% were offered paid time off. Only 23.1% of gas compressor & gas pumping station operators were offered a retirement plan, but 100.0% were offered health insurance and paid time off.
Conclusion
The likelihood of being offered benefits in Wyoming depends largely on full- or part-time status, company size, and industry. Full-time workers were offered benefits at a higher rate than part-time workers. Workers in larger firms were offered benefits more often than those in smaller firms. Larger proportions of workers in natural resources & mining, educational & health services, information, and state & local government were offered benefits than workers in other industries.
Wyoming Benefits Survey 2011 is available online in PDF format at http://doe.state.wy.us/LMI/benefits2011/benefits_2011.pdf.
References
“10 Firms that Remained Committed to Strong Benefits During the Recession.” (2010). Managing Benefits Plans, 10(7), 1-5. Accessed December 14, 2011, from http://proxy.lib.wy.us/login?url=http://search.ebscohost.com/login.aspx?direct=true&db=buh&AN=52259287&ste=ehost-live&scope=site
Catlin, A., Lassman, D., Martin, A., & Whittle, D. (2011). Recession contributes to slowest annual rate of increase in health spending in five decades. Health Affairs. Accessed December 14, 2011, from http://content.healthaffairs.org/content/30/1/11.full.html
Economics Help. (n.d.). Economic Booms. Accessed December 14, 2011, from http://www.economicshelp.org/dictionary/b/booms.html
Goodman, C.J., & Mance, S.M. (April 2011). Employment loss and the 2007-2009 recession: an overview. Monthly Labor Review 134(4). Accessed November 17, 2011, from http://www.bls.gov/opub/mlr/2011/04/art1full.pdf
Holohan, J. (2010, December). The 2007-2009 recession and health insurance coverage [abstract]. Health Affairs. Accessed November 14, 2011, from http://content.healthaffairs.org/content/30/1/145.short
Katz, L.F. (2010, April 29). Long-Term Unemployment in the Great Recession. Testimony for the Joint Economic Committee, U.S. Congress. Accessed December 14, 2011, from http://www.economics.harvard.edu/faculty/katz/files/jec_testimony_katz_042910.pdf
Levi, K. & Wiatrowski, W. (2001, June). Data issues related to employer-provided health insurance: A report summarizing major work of the interagency committee on employment-related health insurance surveys. 1998-2001.
Wen, S. (2010, February). Wyoming Unemployment Insurance benefit payments reach record high in 2009. Wyoming Labor Force Trends 48(2). Accessed November 9, 2011, from http://doe.state.wy.us/LMI/0210/toc.htm
Wyoming Department of Employment, Research & Planning. (2011, May 3). Nonagricultural Employment Growth. Accessed December 20, 2011, from http://doe.state.wy.us/LMI/0211/us_wy.htm
Wyoming Department of Workforce Services, Research & Planning. (n.d.[a]). Wyoming Quarterly Census of Employment & Wages. Accessed December 20, 2011, from http://doe.state.wy.us/LMI/toc_202.htm
Wyoming Department of Workforce Services, Research & Planning. (n.d.[b]). Unemployment Insurance Statistics. Accessed December 21, 2011, from http://doe.state.wy.us/LMI/ui.htm
1A boom is characterized by a period of rapid economic expansion resulting in higher gross domestic and/or state product, lower unemployment, and rising asset prices. Conversely a bust is distinguished by economic recession or downturn (Economics Help, n.d.).
2Wyoming’s state fiscal year goes from July 1 to June 30.