
Chapter 8: Application of Hourly Wage Data: The Future of Education Outcomes Reporting
Understanding rates of compensation for essential occupations, like registered nurses, may help Wyoming employers attract and keep qualified workers. This analysis examines registered nurses (RNs) who worked in nursing and long term care facilities in Casper, Cheyenne, and Sheridan. Research & Planning (R&P) calculated median quarterly compensation, median hourly wages, median number of hours worked, median age, and number of RNs who were continuously employed during a given quarter. The data show that between 2011 and 2012, there was a 38.1% increase in the number of registered nurses working in long term care facilities and a corresponding decrease in median age of RNs, median number of hours worked, median hourly wage, and median quarterly wage during this time.
R&P has a long history of involvement in health care labor market analysis. In 2002 and 2003, R&P published a three-part series on retention and turnover of nurses in Wyoming (Glover, 2002a, 2002b, and 2003). A more detailed three-part analysis by R&P titled “Nurses in Wyoming: Demand, Retention, & Supply,” followed in 2008 (Cowan, Jones, Knapp, Leonard & Saulcy, 2008; Harris, Jones, Knapp, & Leonard, 2008; Saulcy, 2008). R&P’s Public Health Nursing: Succession Planning and Satisfaction Measures in Public Health was published in 2009; the paper discussed past nursing shortages and the potential for future nursing shortages as the demand for health care grows (Jones). Health Care Workforce Needs in Wyoming: Advancing the Study, published in 2011, presented the results of a study on the supply and demand of health care practitioners in rural areas (Glover, Knapp, Leonard, Manning, & Moore, 2011). In 2014, R&P published Nurses Returning to School, which used survey data and statistical analysis to pinpoint the factors that would lead a nurse to return to school for more education (Harris). Further details on nursing employment in Wyoming can be found at http://doe.state.wy.us/LMI/nursing.htm.
To compare quarterly wages of health care practitioners, the previously mentioned research used administrative records; R&P also used Bureau of Labor Statistics survey estimates to compare hourly and weekly wages. Unlike this analysis, none of the previously published papers by R&P used individual records to measure changes in the number of hours worked and rates of hourly compensation.
This chapter focuses on registered nurses who worked between first quarter 2006 (2006Q1) and third quarter 2015 (2015Q3) in nursing and residential care facilities, which “provide residential care combined with either nursing, supervisory, or other types of care as required by residents,” according to the North American Industry Classification System (U.S. Census Bureau, 2012, p. 850). Analysis is limited to long term care facilities in Casper, Cheyenne, and Sheridan because these cities have the largest number of long term care facilities.
In order for an RN to be counted in a quarter, the individual had to have been licensed as a registered nurse, and had to have continuously earned wages from their residential care employer; that is, the RN worked for an employer before, during, and after the quarter in question. For more information about the classification of continuous employment, see “The Instability Index as a Measure of Labor Market Activity” by Glover & Peters (2000).
Results
Quarterly wages and demographic data come from two administrative data sets: Wyoming Wage Records and the Wyoming State Board of Nursing Licensing Files. Details regarding R&P’s data sharing agreements can be found at http://doe.state.wy.us/LMI/LMIinfo.htm. R&P estimated hourly wages and number of hours worked using a statistical process called hot-deck imputation based on the industry, employee turnover, time period, and quarterly earnings including overtime and holiday pay. The imputation process is an evolving one and a forthcoming paper by R&P will review the specific methodology behind hot-deck imputation.
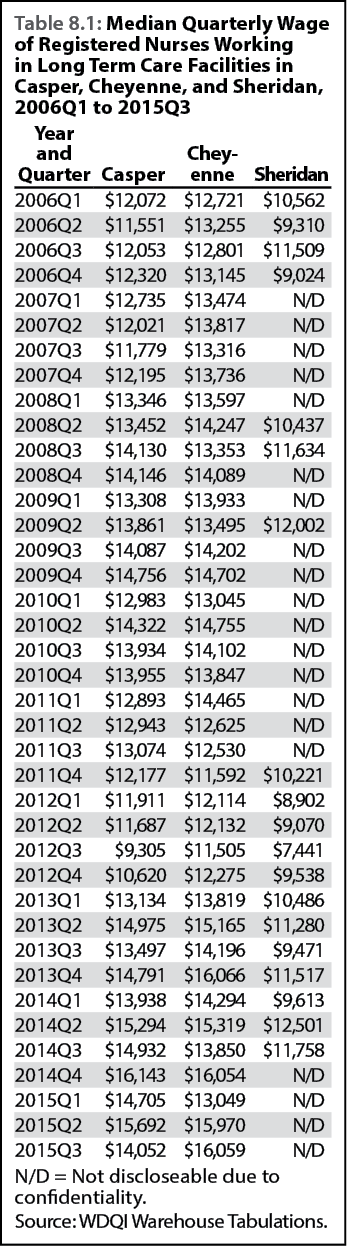
Quarterly wages are an important foundation of R&P’s research. Table 8.1 and Figure 8.1 show median quarterly compensation for RNs between 2006Q1 and 2015Q3. Missing data points indicate that data are non-disclosable due to confidentiality. Generally, Casper nurses earned slightly less than Cheyenne nurses per quarter ($13,302 compared to $13,762) when the median was averaged over time. Sheridan RNs had lower quarterly earnings of around $10,330. Figure 8.1 shows a dip in wages between the beginning of 2011 and the beginning of 2013. Many questions accompany this observation: Did employers change their compensation policies? Were older, higher paid nurses encouraged to retire? Without knowing hourly wages, the conclusions R&P can draw about compensation are limited, which is why new estimates about compensation rates are so important.
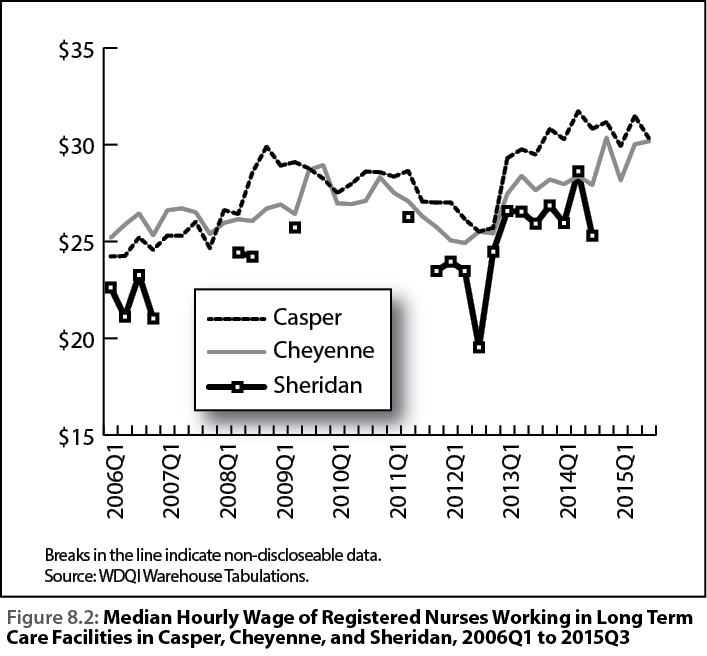
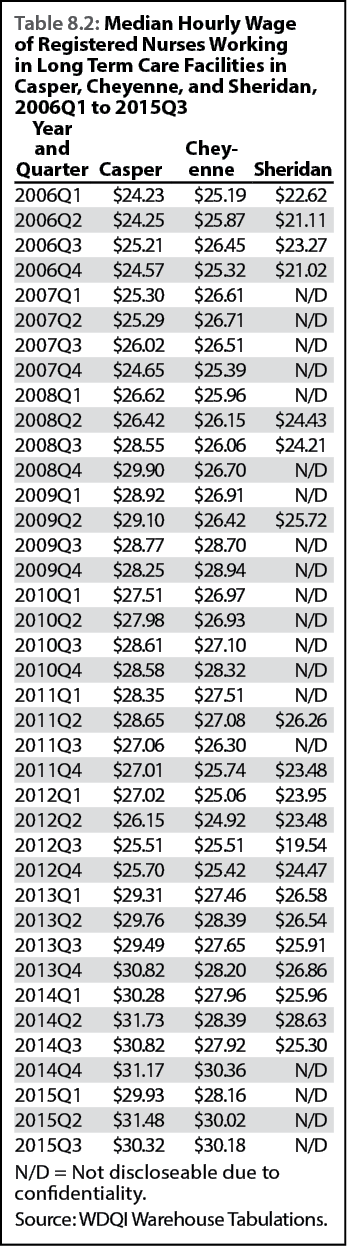
Figure 8.2 and Table 8.2, showing median hourly wages for RNs working in long term care facilities around Wyoming, reveal more detailed labor market information. Again, missing data points indicate that data are non-disclosable due to confidentiality. Overall, Casper nurses had the highest median hourly wages (about $27.93 per hour when the median is averaged over time), almost a dollar more per hour than Cheyenne nurses. This is an important finding because Figure 8.1 shows that Cheyenne nurses usually made slightly more per quarter than Casper nurses; only knowing total compensation would not reveal that Cheyenne nurses were offered a lower rate of compensation. In Sheridan, nurses working in long term care facilities were paid about $24.47 per hour, or $3.46 less per hour than Casper nurses. What drives these differences in compensation rates? Do nurses work fewer hours in Sheridan and Cheyenne? Do lower rates of compensation indicate a less experienced workforce? How does the rate of compensation affect employers’ ability to retain good workers?
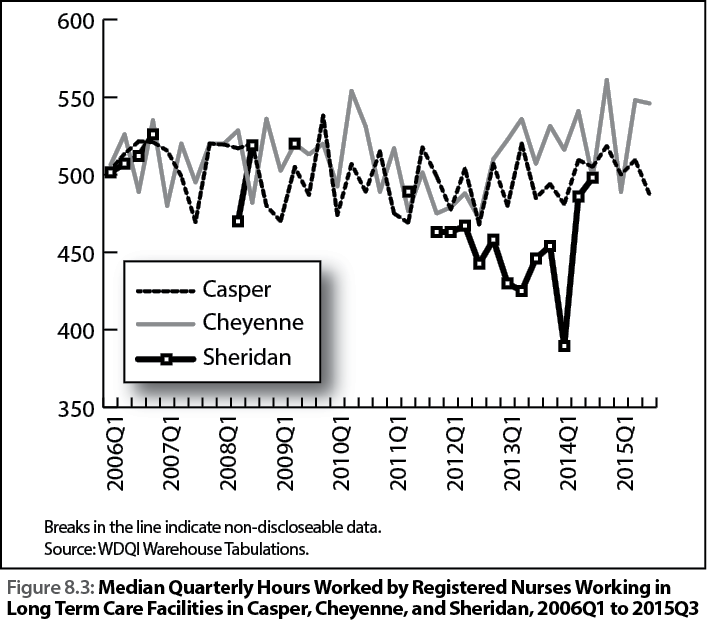
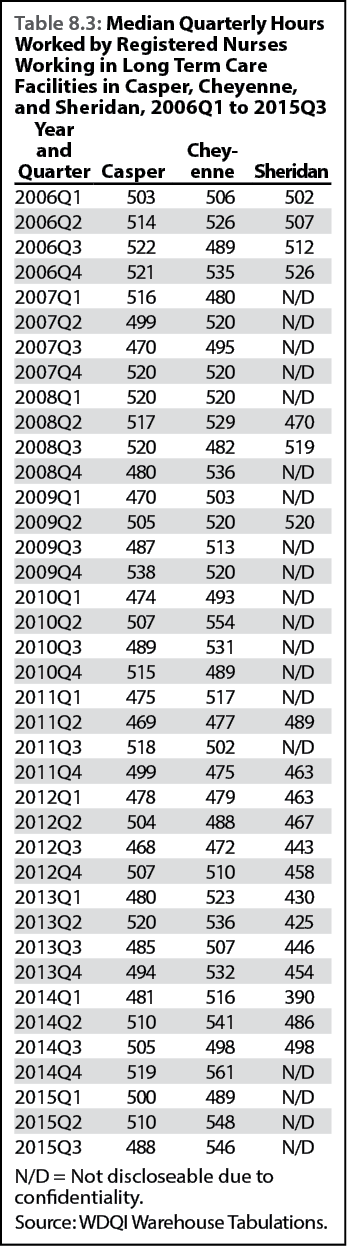
Nurses seem to work close to full time in Casper and Cheyenne, or about 500 hours per quarter, while RNs in Sheridan worked slightly less, as shown in Figure 8.3 and Table 8.3. Given the discloseable information about Sheridan, it appears the median number of hours worked declined from 2011 until the beginning of 2014. The trends for Casper and Cheyenne were less pronounced, but the median number of hours worked seemed to dip slightly for both cities in 2011 and 2012. The drop in the number of hours worked could explain the decline in median hourly wages, as fewer nurses worked overtime shifts. This leads to more questions: was there a statewide drop in demand for nurses? Was there a sudden influx of nurses in 2011 and 2012 which drove down nursing wages?
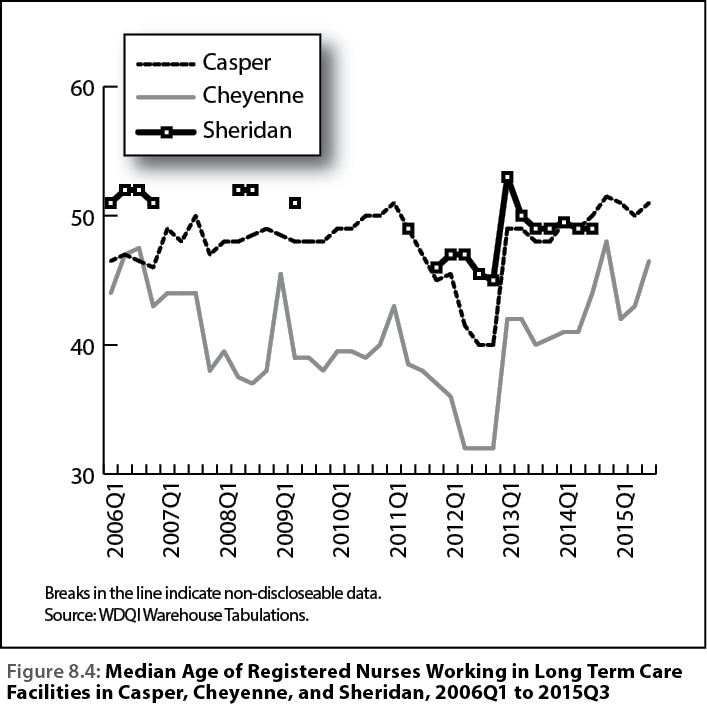
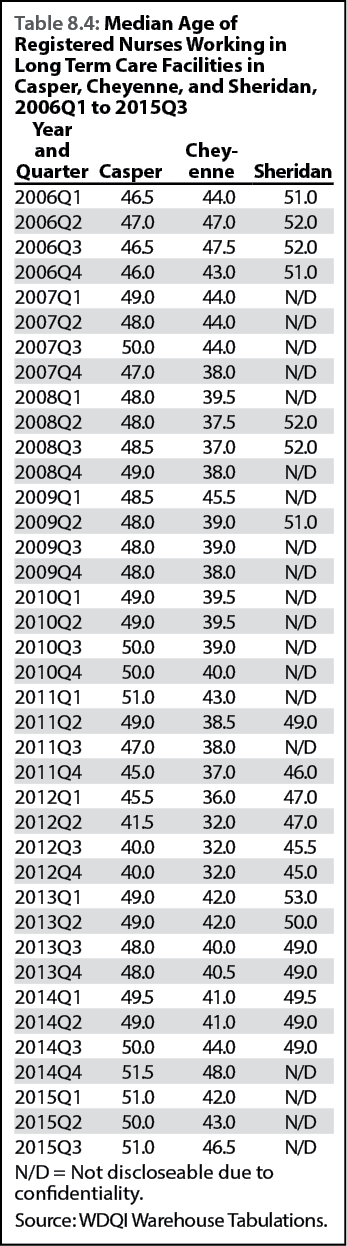
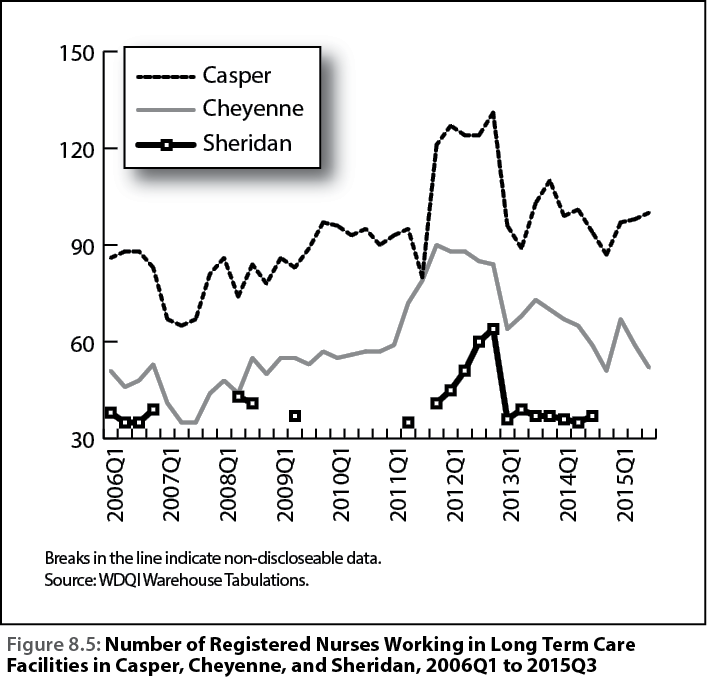
Administrative records contain information about the age and number of nurses working in long term care facilities around Wyoming, and during 2011 and 2012 there was a decrease in the median age of nurses (see Figure 8.4 and Table 8.4) and an increase in the number of nurses employed in long term care facilities (see Figure 8.5). These changes correspond to the dips in median quarterly wages, median hourly wages, and the number of hours worked.
Age, as shown in Figure 8.4, is an important variable when assessing labor market outcomes, because with age come work experience and increased compensation. Using discloseable information, Casper and Sheridan nurses appeared to be about seven to 10 years older than Cheyenne nurses. From 2011Q1 until the end of 2012, the median age of RNs decreased by about 11 years in Casper and Cheyenne, and by about four years in Sheridan, before increasing sharply in 2013Q1.
The number of nurses employed in long term care facilities in Casper, Cheyenne, and Sheridan (see Figure 8.5 and Table 8.5) increased by about 38.1% between 2011Q2 and 2012Q4, before declining back down to 2010 employment levels. It is possible the increase in the number of younger nurses employed in Wyoming’s long term care facilities depressed wages, but there are more questions. Why was there an influx of younger RNs into the long term care labor market? Did depressed compensation rates discourage nurses from working in long term care facilities? The answers to these questions have important implications for initiatives that seek to retain young professionals in Wyoming, such as the Hathaway Scholarship Program.
Discussion
Knowing that a national recession occurred between 2007Q4 and 2009Q2 (National Bureau of Economic Research, 2010), and a statewide downturn occurred between 2009Q1 and 2010Q1 (Moore, 2013), it is logical to assume that some young people left the labor market and returned to school during this time, or delayed entering the labor market until economic conditions improved. Individuals in school during the recession could have graduated as early as 2011, flooding the health care labor market, driving down median age, number of hours worked, hourly wages, and overall quarterly compensation. The trend may have been influenced by the Affordable Care Act of 2010, and the pattern may repeat itself in future economic downturns. Employers and policy makers should be aware that an increased number of post-recession graduates can stagnate or depress wages.
Future Research and Limitations
To better understand the interaction of nursing graduates in Wyoming’s labor market, further studies should examine the history of enrollment and graduation rates from nursing programs at a national and local level. A further look back in time to previous recessions could help predict labor market behavior in future recessions.
This research is limited because the data do not show hourly wages and number of hours worked. This information is not part of an administrative database, which can hold errors constant and allow researchers to more easily account for bias. The process of estimating compensation will continue to evolve, likely encompassing not just the current hot deck imputation strategy, but maximum likelihood estimation, predictive modeling, and machine learning. Regardless, it is difficult to know how accurate estimates of missing data are.
Hourly wage data are available from other sources, such as the Occupational Employment Statistics program (http://www.bls.gov/oes/) run by the Bureau of Labor Statistics (BLS). Unlike R&P’s administrative data, BLS data come from surveys, which go through several statistical adjustments depending on the population and the season. Hourly wage information from the Occupational Employment Statistics program is also limited because estimates are only available for an occupation across all industries. Data differentiating occupational wages by subsector are not available through the BLS.
Future research from R&P will continue to include R&P’s estimates of hours worked because R&P is in a unique situation to calculate hours worked using individual records and to link findings to other data sets exclusive to Wyoming. With data on the number of hours worked, R&P will be able to draw stronger conclusions about labor supply and demand, and also:
- Distinguish change in rates of compensation from changes in overall compensation
- Provide more detailed information to employers and employees
- Monitor outcomes of possible changes in minimum wage in Wyoming
- Assess the number of hours worked by level of education
- Examine the gender-wage gap
- Offer complementary information to federal Bureau of Labor Statistics surveys
- Track wage progression of Hathaway recipients over time
- Calculate the changes of hours worked in the state during times of economic transition
References
Cowan, C., Jones, S., Knapp, L., Leonard, D., & Saulcy, S. (2008, March). Nurses in demand: A statement of the problem. Retrieved from http://doe.state.wy.us/LMI/nursing_demand_08.pdf
Glover, T. (2002a, September). Nursing in Wyoming, part one: Supply and retention [Electronic version]. Wyoming Labor Force Trends, 39(9), 9-15. Retrieved from http://doe.state.wy.us/LMI/0902/a2.htm
Glover, T. (2002b, October). Nursing in Wyoming, part two: Turnover [Electronic version]. Wyoming Labor Force Trends, 39(10), 1, 3-7. Retrieved from http://doe.state.wy.us/LMI/1002/a1.htm
Glover, T. (2003, April). Nursing in Wyoming, part three: Net flow of employment [Electronic version]. Wyoming Labor Force Trends, 40(4), 1, 3-5. Retrieved from http://doe.state.wy.us/LMI/0403/a1.htm
Glover, T., Knapp, L., Leonard, D., Manning, P., & Moore, M. (2011, Fall). Health Care Needs in Wyoming: Advancing the Study. Retrieved from http://doe.state.wy.us/LMI/occasional/occ6.pdf
Glover, T., & Peters, R. (2000, March) .The instability index as a measure of labor market activity. [Electronic version]. Wyoming Labor Force Trends, 37(3), 9-11. Retrieved from http://doe.state.wy.us/LMI/0300/a3.htm
Harris, M., Jones, S., Knapp, L., & Leonard, D. (2008, August). Retention of nurses in Wyoming. Retrieved from http://doe.state.wy.us/LMI/nursing_retention_08.pdf
Harris, P. (2014, May). Nurses returning to school: Motivation and job satisfaction as a buffer between perceived employer discouragement and time constraints. Retrieved from http://doe.state.wy.us/LMI/nursing/2014/Nurses_Returning_to_School.pdf
Jones, Sylvia. (2009, August). Succession planning and satisfaction measures in public health. Retrieved from http://doe.state.wy.us/LMI/phn_09/PHN.pdf
Manning, P. (2016, January). Higher wages and more work: Impact evaluation of a state-funded incumbent worker training program [Electronic version]. Wyoming Labor Force Trends, 53(1), 1, 3-21. Retrieved from http://doe.state.wy.us/LMI/trends/0116/a1.htm
Moore, M. (2013, September). Youths and nonresidents in Wyoming’s labor force, part 2: Career paths and labor shortages [Electronic version]. Wyoming Labor Force Trends, 50(9), 1, 3-12. Retrieved from http://doe.state.wy.us/LMI/trends/0913/a1.htm
Moore, M. (2015, December). Evidence from the New Hires Survey: Education and opportunity in Wyoming’s labor market [Electronic version]. Wyoming Labor Force Trends, 52(12), 1, 3-17. Retrieved from http://doe.state.wy.us/LMI/trends/1215/a1.htm
Moore, M. (2016, January). Employment and wage change for selected industries in Wyoming, 2005Q3-2015Q3 [Electronic version]. Wyoming Labor Force Trends, 53(1), 21-31. Retrieved from http://doe.state.wy.us/LMI/trends/0116/a2.htm
National Bureau of Economic Research. (2010, September 20). US business cycle expansions and contractions. Retrieved from http://www.nber.org/cycles/cyclesmain.html
Saulcy, S. (2008, November). Vacancies and recruitment and retention strategies in health care. Retrieved from http://doe.state.wy.us/LMI/nurse_vacancies_retention.pdf
U.S. Census Bureau. (2012). North American Industry Classification System (p. 850). Lanham, MD: Bernan Press. Retrieved January 20, 2016, from https://www.census.gov/econ/isp/sampler.php?naicscode=623&naicslevel=3