
Higher Wages and More Work: Impact Evaluation of a State-Funded Incumbent Worker Training Program
Summary Article Appendix WDTF Grant Programs Program Evaluation Definitions
The Research & Planning (R&P) section of the Wyoming Department of Workforce Services has undertaken an impact evaluation of the Wyoming Workforce Development Training Fund as part of its Workforce Data Quality Initiative grant (see Program Evaluation). For this research, R&P sought to answer these questions:
- Do WDTF participants earn higher wages after training than they would without training?
- Do trained workers remain in the workforce longer?
The Wyoming Workforce Development Training Fund (WDTF) is a state-funded program that provides new and existing businesses with funding for employee training in order to enhance overall workforce productivity and to promote economic growth in the State (Wyoming Department of Workforce Services, 2012).
The WDTF is comprised of three programs: grants for existing positions, grants for new positions, and new business recruitment (see WDTF Grant Programs). The WDTF database that was made available to R&P for the analysis discussed in this article contained information on the new and existing position applications from 2006Q2 to 2014Q2.
Table 1a displays the distribution of existing and new positions in the dataset analyzed. Business training grants can be used for a wide variety of training programs (see Table 1b) as long as the funding would not be provided by the business or organization as a routine cost of operation. The only public sector organizations eligible for grants are county hospitals (see Table 1c). The industry is selected by the employer on the application based on a list of two-digit North American Industry Classification System (NAICS) industries (see Table 1d). The training fund is used by a variety of industries with a heavy concentration in health care & social assistance; for example, 28.9% (4,055) of all WDTF training recipients from 2006Q2 to 2014Q2 were classified as health care & social assistance worker.
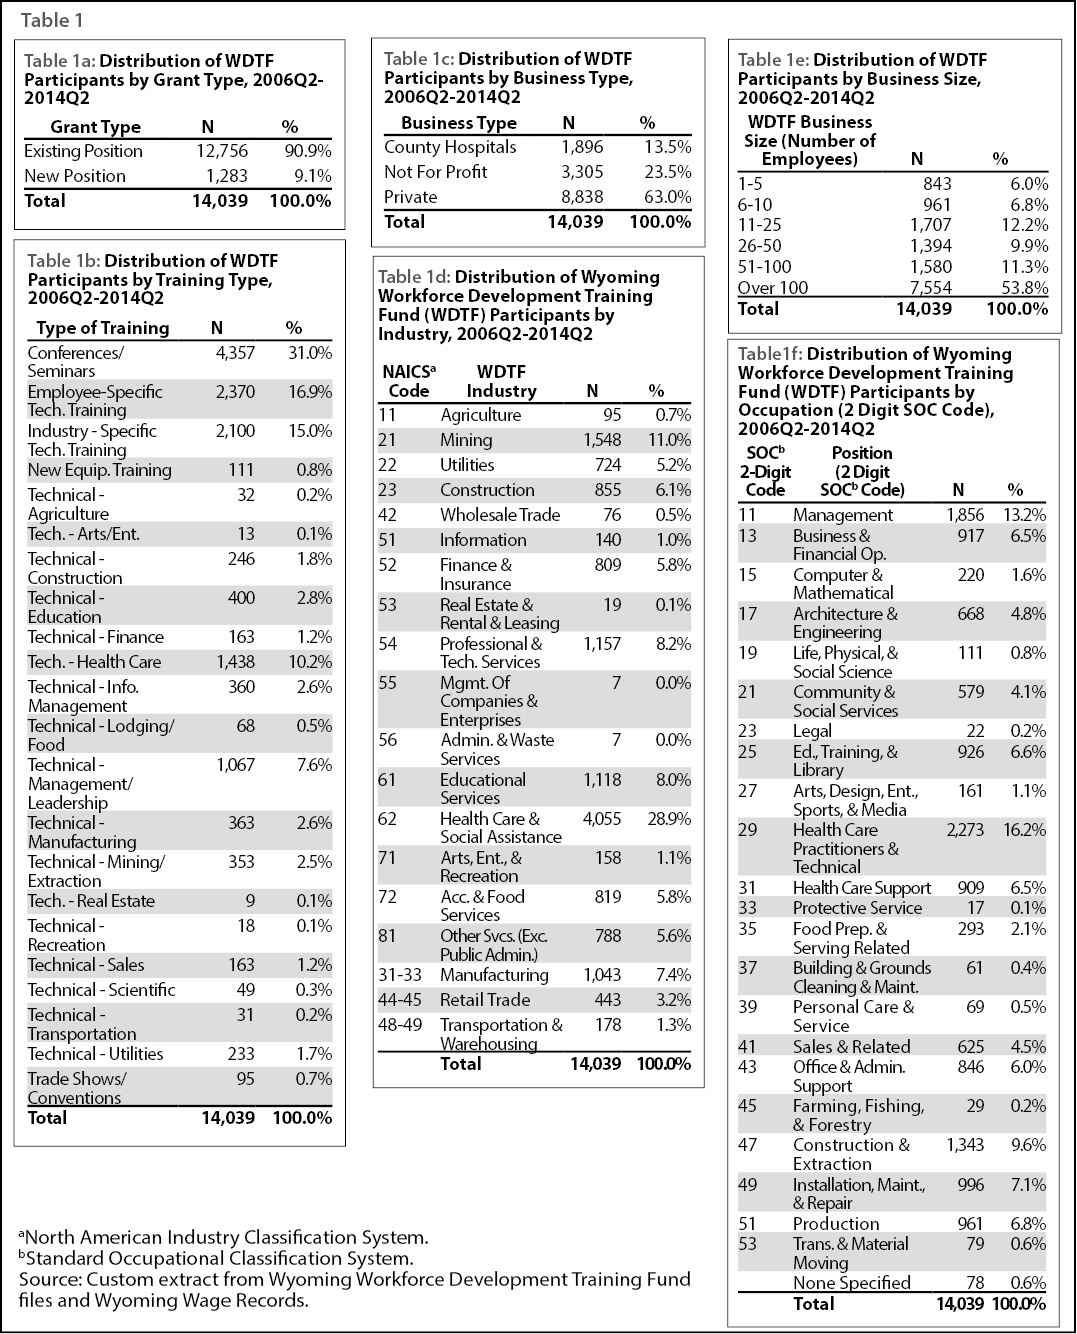
The employer also selects the business size and the employee’s position from a two-digit Standard Occupational Classification (SOC) occupation. Of all training participants in this analysis, 53.8% were employed by businesses with more than 100 employees (see Table 1e). The most frequently occuring occupations in this analysis were health care practitioners & technical occupations(16.2%), followed by management occupations (13.2%; see Table 1f).
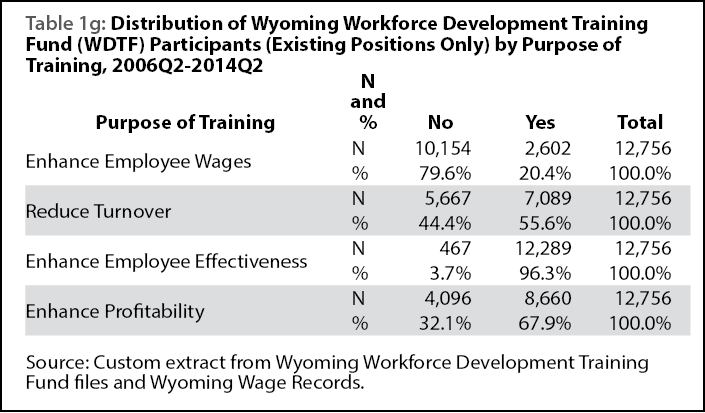
One of the questions on the application for training grants for existing positions requests that an employer check all the following that apply (if any):
The skill upgrade provided by the training (i.e. program goal) will:
- Enhance employee wages
- Reduce turnover
- Enhance profitability
- Enhance employee effectiveness
See Table 1g for the distribution of employer responses to these four questions. This analysis addresses the first two of these goals in relation to the overall Wyoming economy (not necessarily the employer-of-training). The fourth goal is indirectly addressed assuming achievement of the first two goals leads to enhanced employee effectiveness).
Prior Research of Workforce Development Programs
Until relatively recently, there was substantial sentiment that workforce development programs were ineffective for various reasons. For example, due to fragmentation of job training and regulatory restraints, former Assistant Secretary of Labor for Employment and Training Emily Stover DeRocco stated these programs were “all process and no results” (McKinnon and Calmes, 2005). However, new techniques and information are becoming increasingly available for program implementation and evaluation. In regard to data resources, Jacobson and Lalonde (2013) argue, “Through competitive grants such as the Department of Education’s Statewide Longitudinal Data Systems (SLDS) Grant Program and the Department of Labor’s Workforce Data Quality Initiative (WDQI), and through state initiatives, virtually every state is assembling databases necessary to evaluate its educational and training systems.”
Other researchers examine the targeting of workforce training initiatives to those that will receive the most benefit. For example, Heinrich (2013) concluded “Workforce development programs should target (or redirect) more resources for training to less advantaged individuals — i.e., those with lower education levels and limited work experience — who are least likely to receive training from a private employer. Employers have little incentive to offer more general, portable types of training that are more likely to generate external benefits, and firm-specific training is increasingly likely to be offered to only the most-skilled workers.” An additional conclusion from Heinrich stated, “There is a critical need for us to target more resources to adolescents and young adults before and during the sensitive period of their transition from secondary education to additional education and training and/or into the workforce.”
Some researchers argue that the positive impacts of these programs have often been underestimated due to factors such as the use of only short term evaluations (which would adversely affect child development programs disproportionally) and the exclusion of any societal benefits accrued (e.g. crime reduction). Essentially a more comprehensive cost-benefit analysis of these programs is encouraged.
Previous WDTF Research by R&P
Harris (2005) assessed WDTF data from fiscal years 1999 through 2003. Results were reported by wage quintile. It was found that for four of the five years the three lowest quintiles of WDTF participants demonstrated a higher rate of wage progression than non-participants. No clear pattern was found in the two highest wage quintiles. Harris also found that “statistical evidence indicates that WDTF participants have higher rates of retention in Wyoming than either non-participants (general market comparison) or matched controls.”
Other Examples of Workforce Program Results
Hollenbeck and Huang (2006) studied short and long term impacts of workforce development programs in Washington state. Their study estimated the net impacts and private and social benefits and costs of 11 workforce development programs including: Workforce Investment Act (WIA) Title I-B Adult programs, Dislocated Worker programs, apprenticeships, etc. Their findings include:
“Short-term employment impacts are positive for nine of the 11 programs and negative (although not statistically significant) for the other two. Short-term earnings impacts are also positive for nine of the programs, positive but not statistically significant for one of the programs, and negative for the remaining program. The longer-term impacts are similar and even a little better. Employment impacts are positive for all 11 programs, and earnings impacts are positive for 10 of the 11. The benefit-cost analyses show that virtually all of the programs have discounted future benefits that far exceed the costs for participants, and that society also receives a positive return on investment.”
Krantz & Mayne (2015) examined six training services administered by the Utah Department of Workforce Services. Of these, they found that “those receiving degree program, occupational training, or paid internship services were better off because of their interactions with DWS.” The three programs that were found to be relatively ineffective were GED/HS diplomas, unpaid internships, and life skills (other) programs. See Francis (2013) and Heinrich (2013) for an extensive review of workforce development program results. Hollenbeck (2008) conducted a survey of incumbent worker programs by state and studied the results on Massachusetts’s program specifically. The findings include:
“Public subsidy of incumbent worker training, especially in export-based firms, may be an effective economic development tool for states.”
“The rates of return that accrue to states for their training subsidies are substantial and may be indicative of underinvestment.”
“Despite reaping substantial rates of return, our survey of states suggests very modest levels of funding for such training.”
Methodology
Research & Planning linked the WDTF data to wage records and other databases on an individual’s social security number (SSN) and/or a business’s unemployment insurance (UI) number as necessary. The WDTF dataset contains all the businesses’ UI numbers; however, the SSNs for all individuals were not all available from this dataset. Research & Planning was able to link approximately 86% of those individuals with approved training plans (see http://www.wyomingworkforce.org/businesses/wdtf/ for WDTF program criteria) to the wage records database using first and last names and UI accounts. The final dataset of WDTF participants used in this analysis consisted of 14,039 individuals from 2006Q2 to 2014Q2. While a given individual may have had multiple trainings through this program, this analysis only tracks employment outcomes following the first training date.
In many assessments of a program’s impact, it is not possible to employ true randomized experimental and control groups. When this is the case, a nonrandomized design is often employed. In this analysis a quasi-experimental design is utilized. Rossi et al. (1999) state, “One way this is done is to construct experimental and comparison groups by matching program participants as closely as possible to nonparticipants on characteristics that may be associated with the impact of the program. A second way is to statistically equate participating and nonparticipating targets on measured characteristics that may be related to program outcomes. Although the two procedures are different, the logic behind them is the same”. The authors summarize that “In general, the best quasi-experimental design is the one that requires the least amount of matching or statistical adjustment to equate the comparison and experimental groups” (p.340).
Control Group Selection
The base period is the program start quarter (i.e. the quarter WDTF participants started a training program) and the three quarters prior. For example, for the 2007Q2 cohort matching, the year-quarters used in the calculation were 2006Q3, 2006Q4, 2007Q1, and 2007Q2.
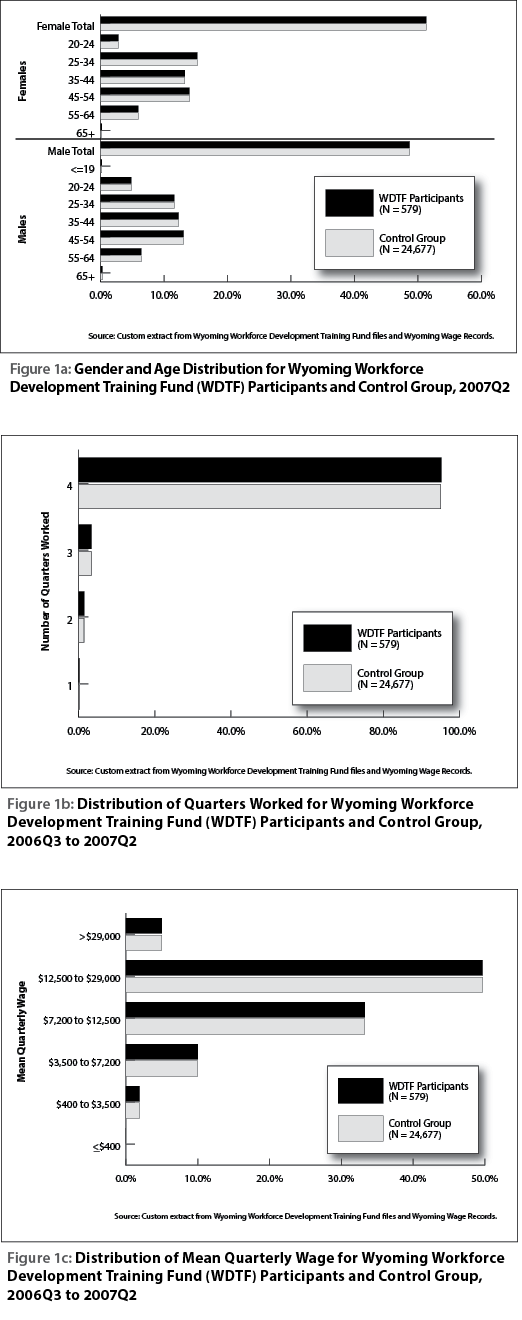 |
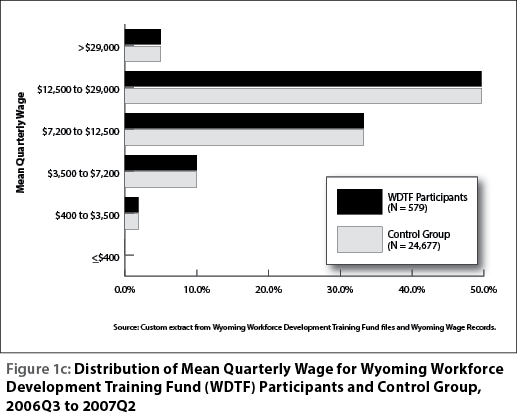
As described by Rossi, 1999, the purpose of selecting a control group is to select a group of workers that display similar attributes to those of the WDTF participants (see Figures 1a-1c). For this research, a matching process was used to select the control group. Selection categories included gender (male/female), age (19 years old or less, 20-24, 25-34, 35-44, 45-54, 55-64, 65+), the number of quarters worked in the base period, and wage group based on the mean quarterly wages in the base period. Six wage groupings were found to most accurately create similar control groups to the WDTF participants for the base period. These wage categories were based on inflation-adjusted quarterly wages of all individuals in R&P’s wage records database. The categories are the low and high outliers (the bottom and top 2.5% of wages), and the remaining quartiles in between.
The resulting wage groupings of mean quarterly wage were:
- Less than $400
- $400 to $3,499
- $3,500 to $7,199
- $7,200 to $12,499
- $12,500 to $28,999
- $29,000+
Control group selection for this research was based on the work of Glover (2002). This involves creating comparable distribution of characteristics (i.e. gender, age group, quarters worked in the base period, quarterly mean wage group in the base period) for the control group as the experimental group while maximizing control group size.
A final component in matching the WDTF participants to a control group is time; that is, a WDTF participant is matched to a non-participant in the year-quarter of the start of training. The reason for this matching is that if WDTF participants and matched controls were compared starting at random time periods, the prevailing economic conditions at those times (e.g. recession/expansion, etc.) could overwhelm any effect of WDTF participation. To partially control for these changing economic conditions, results are presented as year-quarter cohorts (i.e. the year-quarter of the start of training for the WDTF participant and their matching control group individual).
While this paper focuses on the 2007Q2 participant and non-participant cohorts, the remaining 21 cohorts for time periods 2006Q3 to 2011Q4 are presented in the Appendix.
The start year-quarter for the 2007Q2 cohort occurred in a relatively positive economic situation, while the economic situation largely regressed over the next 12 quarters (three years) with an increase in initial unemployment insurance (UI) claims (R&P, 2015a), continued UI claims (R&P, 2015b), and the Wyoming seasonally adjusted unemployment rate (R&P, 2015c).
All wages are discussed in 2014 inflation adjusted dollars in this article. When discussing significance levels in the results section, a 95% confidence level of the estimates was the chosen criteria.
The results section is organized into the following two subsections:
- How well did the control group match the participant group at program start period? This is a necessary condition to examine any future wage increases (or any other metrics of importance) from the start quarter through future time periods between the WDTF participants and the control group. This is accomplished by comparing the demographics of the WDTF participants relative to the control groups by gender and age group, the number of quarters worked in the base period, and the mean quarterly wage in the base period. Given that two dependent groups (i.e. both groups facing similar economic conditions in the Wyoming economy) are being analyzed, the t-test for dependent samples is the appropriate test for assessing whether there is a significant difference between the WDTF participants and the control group.
- Did the WDTF participant group and control group exhibit significant differences in the change in mean quarterly wage over the 12 quarters after the program start quarter? Additionally, was there a difference in retention rates over time? This is accomplished by tracking the mean quarterly wages and participation rates (relative to the start quarter) of both groups for three quarters before the program start year-quarter through the 12 quarters after the start year-quarter (see Table 2 and Figure 2). The standard deviation of these wages is displayed, as well as the t-test determining whether the wage differences between the two groups are statistically significant (in a given quarter). A paired t-test is an appropriate test to be employed in determining whether the wage differences between the two groups as pre- and post-intervention effects of WDTF participation (or lack thereof in the case of the control group).
While differences in any given quarter are one measure of wage differences between the two groups, effects such as the seasonality of given industries or occupations could cause substantial variation for a given quarter. Therefore, mean quarterly wage differences between the two groups over time were tested at four quarters (one year), eight quarters (two years), and 12 quarters (three years) after the program start year-quarter using a paired t-test. The mean quarterly wage difference was calculated by subtracting the mean quarterly wage of the base period from the mean quarterly wage of the post-training period. For example, the mean quarterly wage difference for 2007Q2 WDTF participants at 12 quarters was $929: a post-training period mean quarterly wage of $16,471 minus a base period mean quarterly wage of $15,542. By comparison, the mean quarterly wage difference for the control group (non-WDTF participants) at 12 quarters was $17: a post-training period mean quarterly wage of $15,243 minus a base period mean quarterly wage of $15,226.
Results
It is important to assemble a control group as similar as possible to that of the WDTF participants during the base period. As can be seen in Figures 1a-1c, the WDTF participants from 2007Q2 and the control group (non-WDTF participants) selected by R&P demonstrated very similar distributions across gender, age, quarters worked in the last four quarters, and wage group. The same is true of all other cohorts as well (see the Appendix). The 2007Q2 cohorts exhibited a slight female majority (51.3%), approximately 95% had worked in all four of the previous four quarters, and slightly less than half had a mean quarterly wage of $12,500 to $29,000 over that same period.
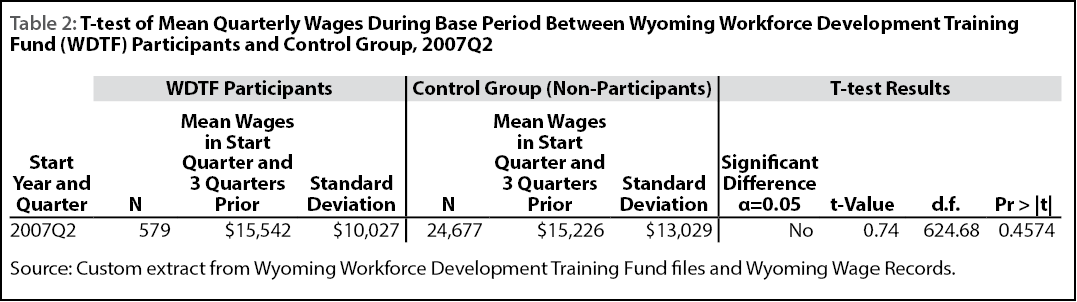
Table 2 shows that overall, the mean quarterly wages for the WDTF participants and the control group were not significantly different during the base period. Table 2 is important in determining whether wage differences between the two groups can be statistically compared after the start year-quarter. If the control group selection is conducted effectively, the mean quarterly wages in the base period between the two groups should rarely be significantly different. The null hypothesis is that the mean wages between the two groups are equal. Failing to reject the null hypothesis is a prerequisite to signifying the control group is suitably matched to the WDTF participant group for further analysis. The results from Figures 1a-1c and Table 2 demonstrate this was indeed the case. In fact, of the 22 WDTF participant and control group cohorts analyzed, only one (2009Q4) showed a significant difference.

Figure 2 displays the mean quarterly wage of both the 2007Q2 WDTF participants and the control group for the same period, the three quarters prior to, and the 12 quarters after WDTF training. The program start year-quarter (2007Q2) is identified by an arrow. Statistically significant wage differences between WDTF participants and the control group for a given year and quarter are marked with an “X” over the corresponding year-quarter. The bar chart in Figure 2 shows that the mean quarterly wage for WDTF participants was significantly higher than the mean quarterly wage of non-participants in eight of the 12 quarters following the training received by the WDTF participants. In addition, the line chart in Figure 2 shows that a greater proportion of WDTF participants could be found working in Wyoming during those 12 post-training quarters than non-participants. After 12 quarters, 84.1% of WDTF participants were found in wage records, while 78.8% of the control group was represented. This represents an average annual decrease of 0.8% for WDTF participants compared to 1.2% for non-participants. This higher retention rate in the Wyoming economy over time is generally true across all cohorts.
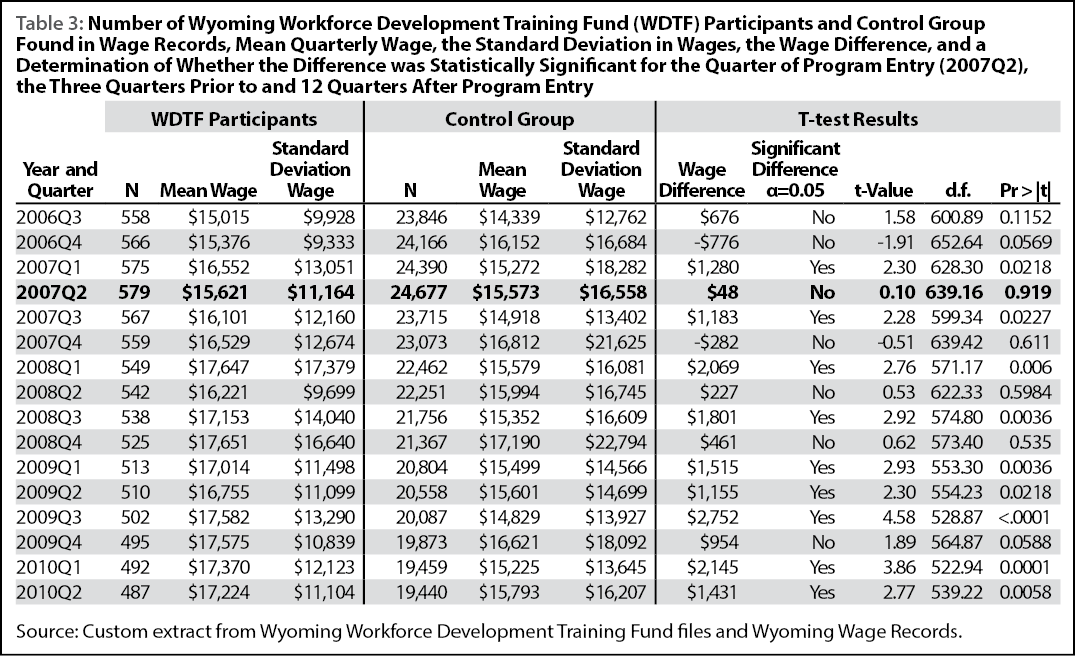
Table 3 shows the data used to create Figure 2, along with the number of workers in the WDTF program and the control group. Of the 16 quarters shown in Table 3 and Figure 2, nine of the 16 differences (56.3%) in wages between WDTF participants and non-participants were statistically significant. All nine demonstrated that WDTF participants exhibited higher mean quarterly wages than non-participants.

Table 4 displays the paired t-test results of the mean quarterly wage difference across selected time periods, from the start year-quarter of training (in this case, 2007Q2) to four quarters (one year), eight quarters (two years), and 12 quarters (three years) later. The t-test used in this analysis indicated that WDTF participants experienced higher (and statistically significant) wage increases than non-WDTF participants. In real (inflation-adjusted) dollars, WDTF participants experienced an increase of $929 12 quarters after the training period (2007Q2), compared to a $17 increase for non-WDTF participants.
 |
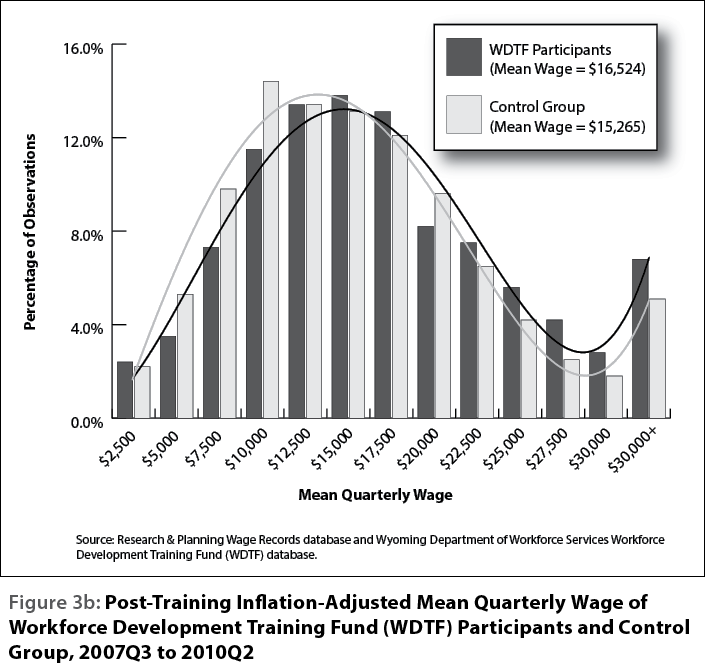 |
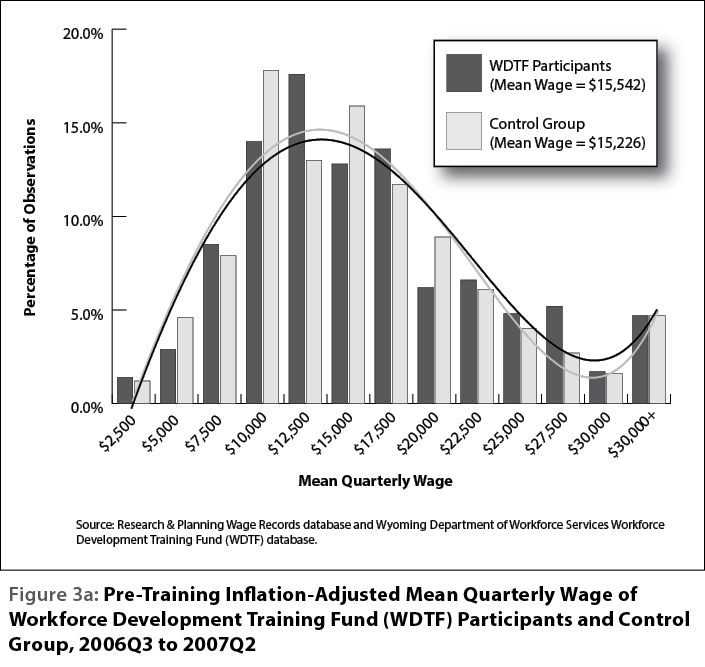
Figures 3a and 3b display the distribution of the WDTF participants and the control group in the pre- and post-intervention periods (12 quarters after intervention), respectively. The following figures show the frequency distributions of each group, with 13 wage groupings. The control groups were selected using six wage groupings relative to the WDTF participants (see Figure 1c). Therefore, while the frequency distribution of wages is the same between the two groups using the six original wage groupings, using 13 delineations accounts for the slight deviations between the two groups in Figure 3a. Thirteen delineations were used in these figures to allow for more differentiation and equal intervals between groupings ($2,500).
In the base period, WDTF participants had a mean quarterly wage of $15,542 while the control group had a mean quarterly wage of $15,226, a difference that was not statistically significant. In both figures, the distributions are positively skewed (i.e. the right tail of each distribution is longer than the left tail, corresponding to a smaller number of occurrences at the high end of the distribution) with the control group being positively skewed more so than the WDTF participant group. Note: Figures 3a and 3b do not demonstrate this skewness in a textbook fashion, as all large observations are contained in the $30,000+ wage grouping.
By 2010Q2, a greater proportion of WDTF participants (5.8%) moved into the highest six wage groupings relative to the control group (1.8%). This tended to shift the WDTF participant mean quarterly wage distribution to the right of the control group.
Collectively, these changes led to the two groups diverging from a non-significant difference in mean quarterly wage. The WDTF participants experienced a significant wage increase ($16,524 mean quarterly wage) relative to the control group ($15,265).
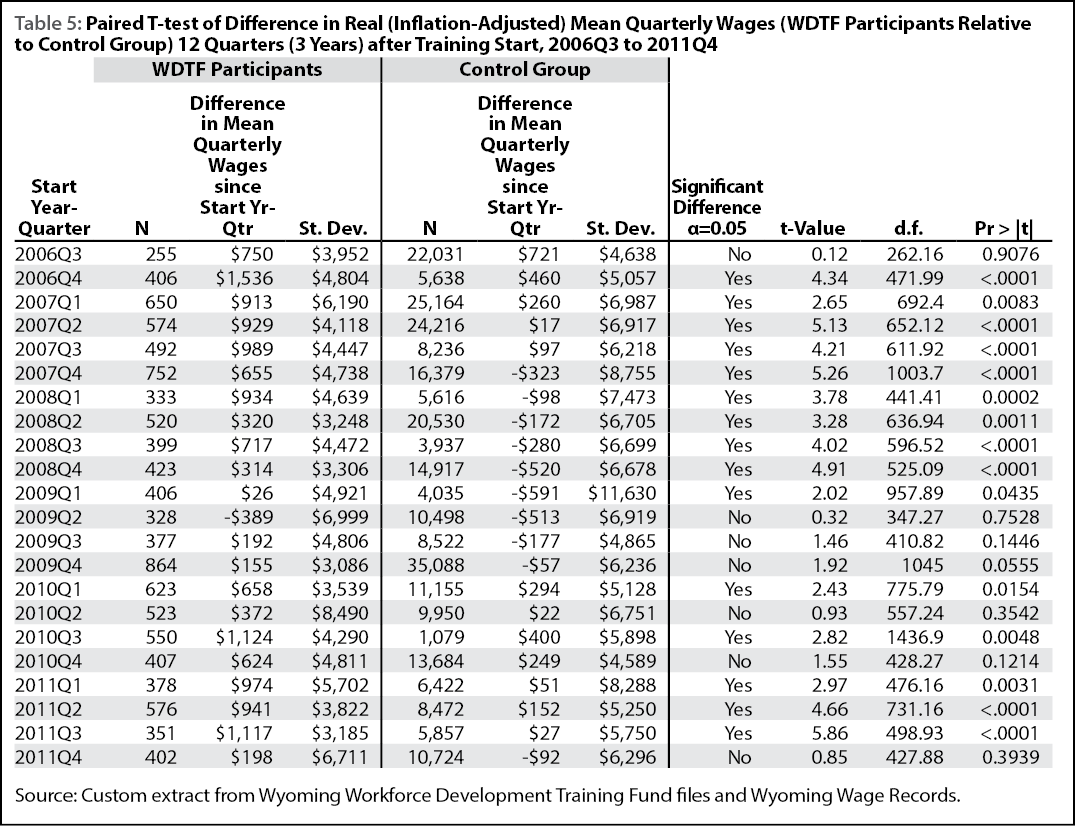
Of the 22 WDTF participant cohorts analyzed in this research (2006Q3 to 2011Q4), 15 experienced a significant wage increase relative to the control group (non-WDTF participant) cohorts from the same year and quarter (see Table 5). Full results for each cohort are published in the Appendix to this article.
Future Research
For this analysis, control groups were chosen using four main groupings (gender, age group, number of quarters worked in the last four quarters, and wage group) that could all be considered categorical variables (although number of quarters worked could also be considered a discrete variable). Further analysis may include discrete or continuous variables in addition to, or in place of, some of these categorical variables. A logistic propensity scoring model would allow for the use of more discrete/continuous variables. For example, rather than a wage grouping, a worker’s exact quarterly wage could be included in the model. Resulting propensity scores for participants could then be matched to those of non-participants within a certain tolerance of variation.
Recent research suggests that propensity scoring may yield superior matching results to other matching methods. For example, Dehejia and Wahba (1999) found that “when we apply these methods (propensity scoring) to … nonexperimental data for a range of propensity score specifications and estimators, we obtain estimates of the treatment impact that are much closer to the experimental treatment effect than … nonexperimental estimates.”
While the analysis discussed in this article focuses on wage changes and attachment to the Wyoming labor force collectively, further analysis could explore program effects on tenure with a given employer or industry. One paradoxical result of such an analysis is that the program itself could be deemed successful in terms of retaining workers in the Wyoming labor force; however the program could actually lead to churn between employees/employers or employees/industries as workers search for more desirable employment opportunities. Thus, while the WDTF program may benefit Wyoming as a whole, it may also cause hardship to a given employer that provided WDTF matching funds.
As stated in the introduction, this analysis only tracked program effects after the first training event. In the future, the effect of multiple training events for the same individual could be explored. Also, the current analysis treated a training event as a dichotomous event (i.e. “did a worker receive training, yes or no?”). Future research could explore if the type of training received has any influence on program effects.
This analysis examines possible positive effects of the WDTF program (e.g. enhanced wage progression). However, for a more comprehensive analysis, the benefits accrued due to the program (including any quantifiable societal benefits) should be compared to the program cost (i.e. cost/benefit analysis). By conducting this analysis on specific factors such as type of training, it may be possible to identify the aspects of the WDTF program that allocate funds the most efficiently.
Combining Efficient Program Administration with Effective Evaluation Strategies
During the past several decades, state and federal governments have placed an increased emphasis on program evaluation for programs that utilize public funding. The Government Performance and Results Act of 1993 and several memorandums from the Office of Management and Budget between 2009 and 2012 promoted an emphasis on program evaluation and the use of these evaluations in budget establishment.
Going forward, the application process could be modified to aid in efficient program evaluation. Many of the questions on the application are employer-reported. During the application review process, fields such as business type (based on a two-digit NAICS grouping) and business size could be verified by DWS. Relying solely on employer-reported information may lead to inaccurate information being used in evaluation. For example, if the business type is employer-reported, two companies that provide the same service could choose two different but similar categories, such as information (two-digit NAICS code = 51) or professional & technical services (two-digit NAICS code = 54; see Table 1d). There are no definitions provided during the application process to aid in selecting the appropriate industry. Ideally, a DWS employee would verify the correct NAICS code for future evaluation.
The same reasoning would hold true when choosing the type of training. For example, how should a health care provider choose between technical, health care and industry-specific technical training (see Table 1b)? Documentation and definitions for each field should be provided to guide the employer in making these decisions. Similar documentation also should be available to the evaluator. Incorrect information could skew the creation of control groups if they were based on types of business and training.
Another issue that could be addressed is developing a methodology for choosing a consistent time frame to determine the size of the business. On the new positions application (see the Appendix), the size of the business is determined by the question, “Highest number of employees on payroll during the past 12 months,” while on the existing position application (see the Appendix online) the question is simply “Number of Employees.” Ideally, all applications would address the business size (based on the number of employees) in a way that is based on a consistent time period. The Quarterly Census of Employment and Wages – an administrative database utilized by R&P, the U.S. Bureau of Labor Statistics, and other agencies – determines the employment as of the 12th of the month. This data source would likely be utilized to construct a control group based on business size. One possibility is asking the employer the number of employees on the 12th day of the month of the expected training start date.
Perhaps not all these aspects can be addressed, but the role of evaluation in overall program administration should be considered when addressing the objectives of a program. Further recommendations regarding a similar program (i.e. Human Capital Management Services JobAssist Program in Wyoming) will be published in a forthcoming article from R&P.
References
Dehejia, R.H., & Wahba, S. (1999). Causal effects in nonexperimental studies: Reevaluating the evaluation of training programs. Journal of American Statistical Association, 94(448), 1053-1062.
Francis, C.M. (2013). What we know about workforce development for low-income workers: evidence, background and ideas for the future. National Poverty Center Working Paper Series. Retrieved August 19, 2015, from http://npc.umich.edu/publications/u/2013-09-npc-working-paper.pdf
Glover, W. (2002), Compared to what? Purpose and method of control group selection. Wyoming Labor Force Trends, (39)6. Retrieved August 6, 2015, from http://doe.state.wy.us/lmi/0602/a2.htm
Harris, M. (2005). Labor market outcomes of Workforce Development Training Fund participants. Occasional Paper No. 3. Workforce Development Training Fund Evaluation at the Macro and Micro Levels. Research & Planning, Wyoming Department of Workforce Services. Retrieved August 11, 2015, from http://doe.state.wy.us/LMI/Occasional/No3/Occasional_3.pdf
Harris, P. (In press). Impact evaluation of the Human Capital Management Services (HCMS) JobAssist program in Wyoming.
Heinrich, C.J. (2013). Targeting workforce development programs: Who should receive what services? And how much? University of Maryland School of Public Policy. Retrieved August 18, 2015, from http://umdcipe.org/conferences/WorkforceDevelopment/Papers/
Workforce%20Development_Heinrich_Targeting%20Workforce%20Development%20Programs.pdf
Hollenbeck. K. (2008). Is there a role for public support of incumbent worker on-the-job training? Policy Paper No. 2008-001. W.E. Upjohn Institute for Employment Research. Retrieved October 21, 2015, from http://research.upjohn.org/cgi/viewcontent.cgi?article=1000&context=up_policypapers
Hollenbeck, K. & Huang, W.J. (2006). Net impact and benefit-cost estimates of the workforce development system in Washington state. Upjohn Technical Report No. 06-020. Kalamazoo, MI: W.E. Upjohn Institute for Employment Research. Retrieved August 7, 2015, from http://research.upjohn.org/cgi/viewcontent.cgi?article=1023&context=up_technicalreports
Jacobson, L. & LaLonde, R.J. (2013). Using data to improve the performance of workforce training. Brookings. Retrieved August 18, 2015, from http://www.brookings.edu/research/papers/2013/04/17-jacobson-lalonde-workforce-training
Krantz, J. & Mayne, C. (2015). Policy highlights from “Is job training justified?” An analysis of job training services as administered by Utah’s Department of Workforce Services. Retrieved August 11, 2015 from https://jobs.utah.gov/wi/trainingstudy/jobtraining.pdf
Lalonde, R. (1986). Evaluating the econometric evaluations of training programs. American Economic Review, 604-620. Office of Management and Budget. (1993). Government Performance Results Act of 1993. Retrieved October 21, 2015, from https://www.whitehouse.gov/omb/mgmt-gpra/gplaw2m
Office of Management and Budget. (2009). Memorandum for the heads of executive departments and agencies. M-10-01. Dated October 7, 2009. Retrieved October 21, 2015, from https://www.whitehouse.gov/sites/default/files/omb/assets/memoranda_2010/m10-01.pdf
Research & Planning, Wyoming Department of Workforce Services. (2015a). Normalized Initial Unemployment Claims: 2005-2015. Updated August 2015. Retrieved August 7, 2015, from http://doe.state.wy.us/LMI/ui/initial_chart.htm
Research & Planning, Wyoming Department of Workforce Services. (2015b). Normalized Continued Weeks Claimed: 2005-2015. Updated August 2015. Retrieved August 7, 2015, from http://doe.state.wy.us/lmi/ui/cont_chart.htm
Research & Planning, Wyoming Department of Workforce Services. (2015c). Wyoming Seasonally Adjusted Labor Force, Employment and Unemployment, 1976-2014. Updated August 2015. Retrieved August 7, 2015 from http://doe.state.wy.us/LMI/LAUS/7800sa.htm
Rossi, P. H., Freeman, H.E., & Lipsey, M.W. (1999). Evaluation a Systematic Approach (Sixth ed., pp. 309-340). Thousand Oaks, CA: Sage Publications. Statistical Consultant System (2010). Two sample t-test with SAS. A system to teach statistical application. Retrieved August 6, 2015, from http://www.stat.purdue.edu/~tqin/system101/method/method_two_t_sas.htm
Wyoming Department of Workforce Services (2012). Workforce Development Training Fund Home. Retrieved February 26, 2016, from http://wyomingworkforce.org/businesses/wdtf/