
Employment and Wage Change for Selected Industries in Wyoming, 2005Q3-2015Q3
Wyoming QCEW Summary Statistics by Industry
Employment and wages in Wyoming continued to decline from year-ago levels in third quarter 2015 (2015Q3), according to the most recent data from the Unemployment Insurance employer payroll tax system. This is the first time that total wages, average monthly employment, and average weekly wage decreased from prior-year levels for consecutive quarters since the state’s economic downturn of 2009Q1 to 2010Q1. Total payroll represents approximately 43% of what households in Wyoming can spend on goods, services, and housing (Bullard, 2013).
The Research & Planning (R&P) section of the Wyoming Department of Workforce Services publishes employment and wage estimates across all industries in Wyoming four times per year in Wyoming Labor Force Trends (January, April, July, and October) as part of the Quarterly Census of Employment and Wages (QCEW) statistical program. The current issue of Trends includes employment and wage estimates for 2005Q3 to 2015Q3. In addition, R&P updates its website quarterly to include QCEW employment and wage estimates at the industry and county levels. These tables are available at http://doe.state.wy.us/LMI/toc_202.htm.
For the purposes of this article, a downturn is defined as a period of at least two consecutive quarters when Wyoming experienced an over-the-year decrease in total wages, average monthly employment, and average weekly wage. There are two periods of economic downturn discussed in this article. In 2009Q1, Wyoming entered an economic downturn that lasted five quarters (2009Q1 to 2010Q1); this is referred to in this article as the previous downturn. Employment and wage levels decreased during each of those five quarters compared to previous year levels. After a period of moderate growth that lasted from 2010Q2 to 2015Q1, Wyoming entered another downturn that began in 2015Q2; this is referred to in this article as the most recent downturn.
|
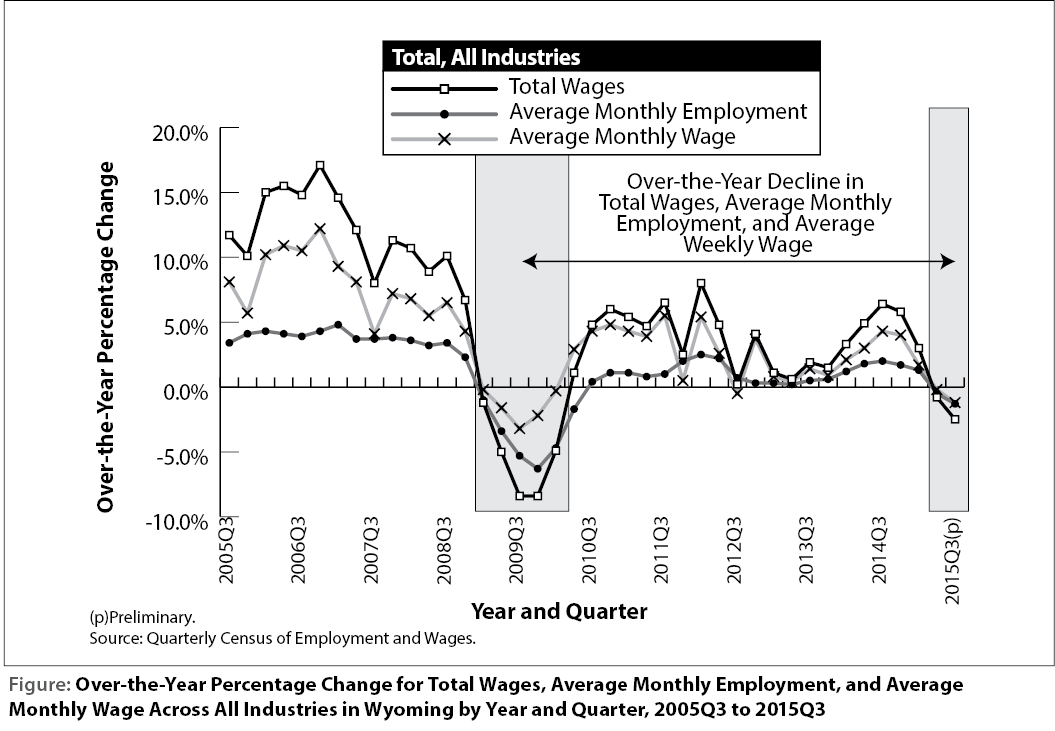
The QCEW Figure shows the over-the-year percentage changes in employment and wages in Wyoming from 2005Q3 to 2015Q3; periods of economic downturn are illustrated with shaded boxes. From 2005Q3 to 2008Q4, Wyoming experienced a period of rapid economic growth; during this period, wage and employment levels increased from prior year levels during every quarter. Wyoming then entered the previous downturn (2009Q1 to 2010Q1), followed by a period of moderate growth (2010Q2 to 2015Q1), and then the most recent downturn that began in 2015Q2. During the period illustrated in this graph, the over-the-year change in total wages was as high as 17.1% (2006Q4) and as low as -8.4% (2009Q3 and 2009Q4).

|
This article provides a brief discussion on the economic trends in four selected industries in Wyoming: support activities for mining, private coal mining, construction, and educational & health services. Each industry responds differently to the state’s economic conditions, and has its own trends, peaks, and troughs in the graphics presented in this article. Table 1 shows the over-the-year percentage change in average monthly employment for each of these four industries, with periods of economic downturn shaded gray. Table 1 shows that during the previous downturn, support activities for mining experienced a substantial decline in average monthly employment during four of the five quarters, while education & health services experienced an over-the-year increase during each of the five quarters.
|
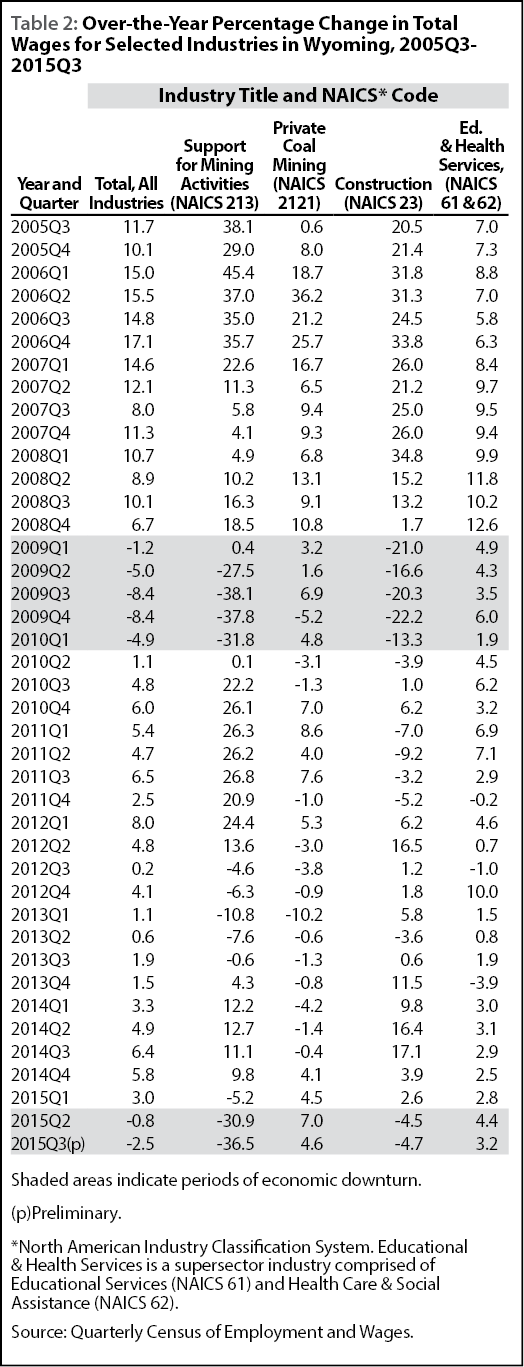
Table 2 shows the over-the-year percentage change in total wages. The decrease in total wages in support activities for mining during the first two quarters of the most recent downturn (-30.9% and -36.5%, respectively) were similar to the decrease seen throughout the previous downturn (-27.5% in 2009Q2 to -38.1% in 2009Q3). Over-the-year increases in total wages in educational & health services were similar during both periods of downturn.
Comparable graphics to the QCEW Figure are included for each of the four industries discussed in this article. Employment and wage tables for the industry level in Wyoming are available online at http://doe.state.wy.us/LMI/toc_202.htm.
Support Activities for Mining (NAICS 213) and Coal Mining (NAICS 2121)
In the fall of 2015, “Wyoming’s economy was exposed to a substantial decline in the prices of oil, an extended period of low natural gas prices, and the erosion in the price of coal” (R&P, in press). The effects of the diminished demand for these natural resources can clearly be seen in support activities for mining (see Figure 1) and private coal mining (see Figure 2). The support activities for mining subsector and private coal mining industry group are part of the mining sector as identified by the North American Industry Classification System (NAICS).
According to NAICS, businesses in the support activities for mining (NAICS 213) subsector primarily provide “support services, on a contract or fee basis, required for the mining and quarrying of minerals and for the extraction of oil and gas” (BLS, 2014). In addition, this industry also includes establishments that perform exploration (except geophysical surveying and mapping) for mining.
|
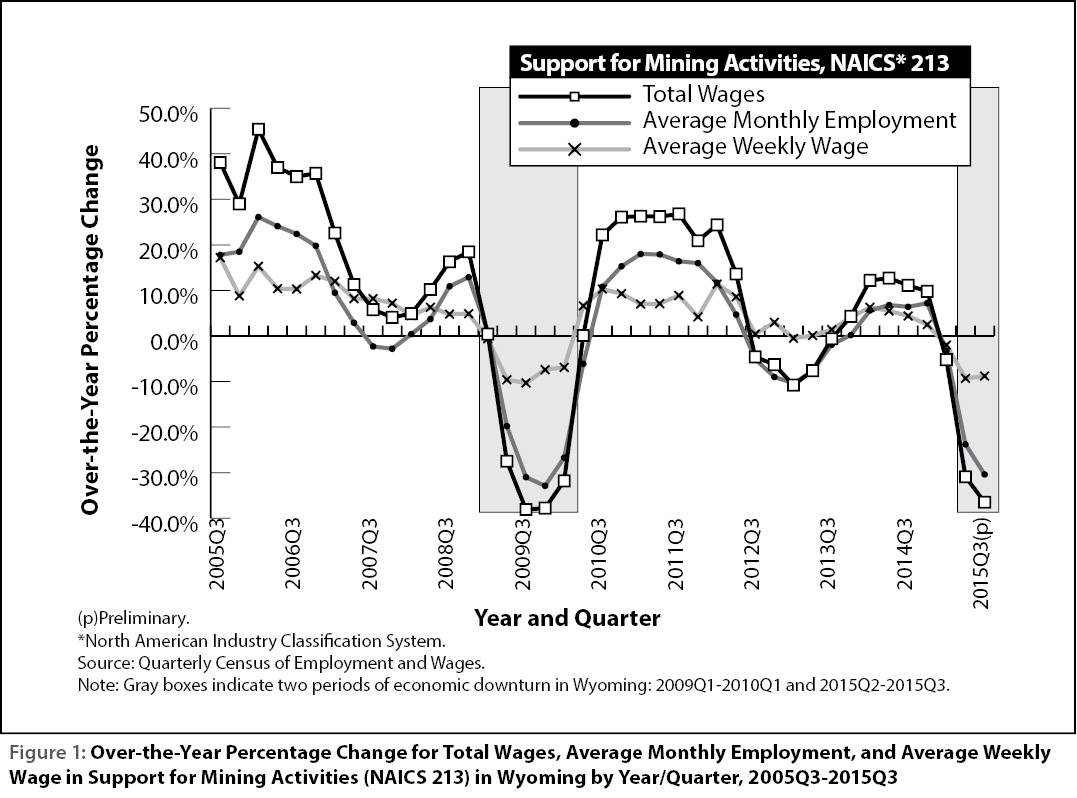
Figure 1 shows that the over-the-year percentage changes in total wages, average monthly employment, and average weekly wage for support activities for mining (NAICS 213) followed a similar trend as Wyoming’s overall employment and wage levels (see the QCEW Figure). However, the peaks and troughs for support activities for mining were much greater. For example, total wages for this subsector increased over prior year levels as much as 45.4% (2006Q1) during the period of rapid economic expansion and decreased by approximately 38% for two quarters (2009Q3 and 2009Q4) during the previous downturn. During the most recent downturn, the over-the-year decline in total wages was much greater in 2015Q3 for support activities for mining (-36.5%) than it was for the statewide average (-2.5%).
|
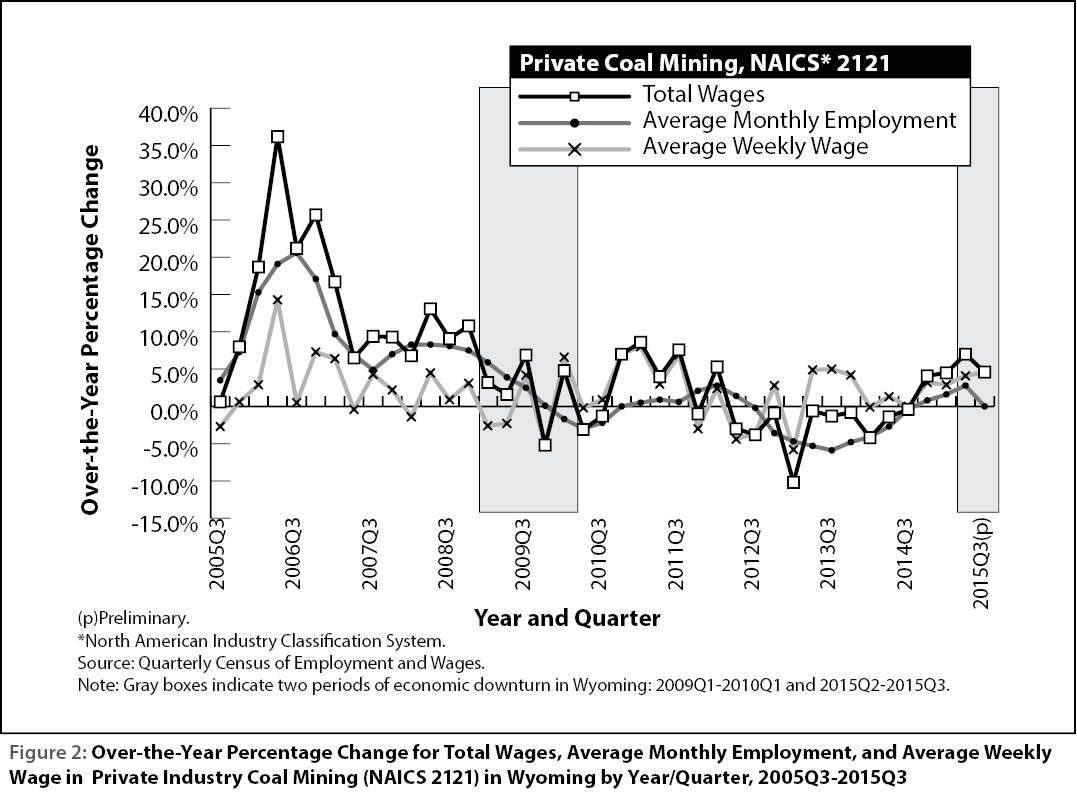
Figure 2 shows that over-the-year changes in Wyoming’s private coal mining industry group (NAICS 2121) were much different from the statewide average. Total wage growth occurred during each quarter of the economic expansion from 2005Q3 to 2008Q4, but has fluctuated ever since. Private coal mining experienced over-the-year growth in employment even well into the previous downturn, but then experienced 10 consecutive quarters of decline from 2012Q2 to 2014Q3. Figure 2 shows that the coal mining industry group experienced an increase in total wages and average weekly wage during the most recent downturn, even when most industries experienced a decrease.
Construction (NAICS 23)
|
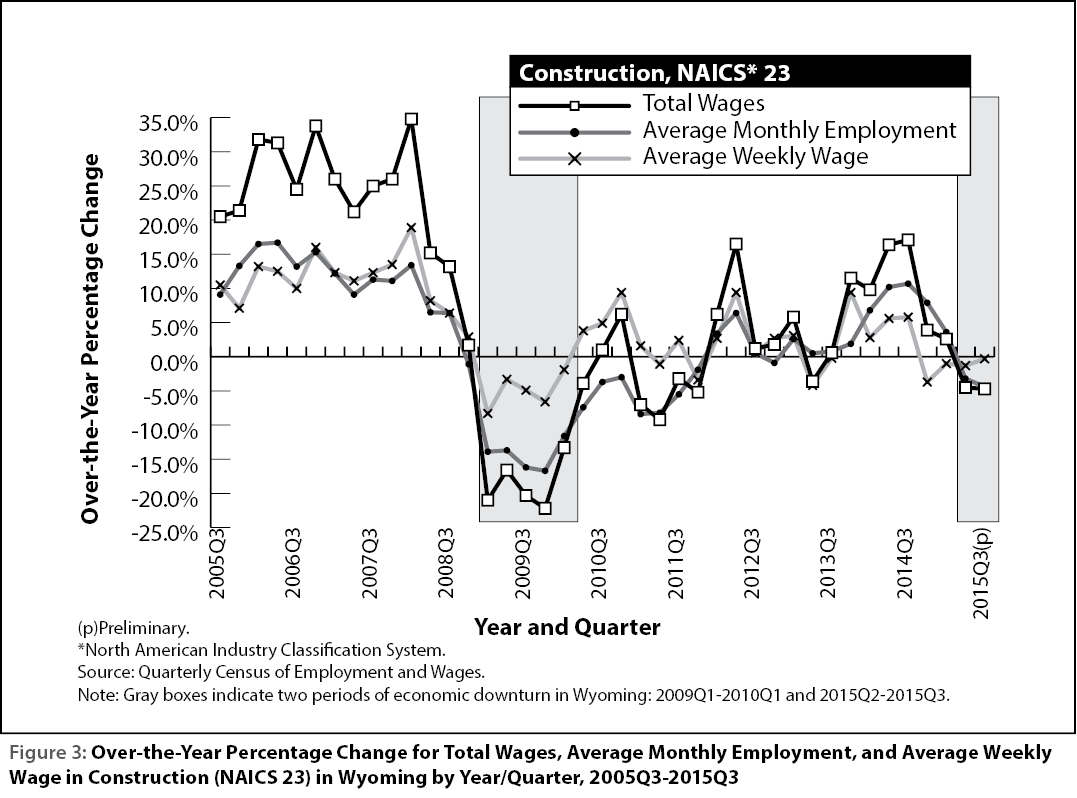
Employment and wage levels in Wyoming’s construction industry are highly seasonal, usually peaking in the summer months (second and third quarters). As shown in Figure 3, total wages increased rapidly during the period of economic expansion, with a peak over-the-year increase of 34.8% in 2008Q1. The over-the-year decrease in average monthly employment in construction preceded the previous downturn by one quarter (-1.1% in 2008Q4). In 2009Q1 (the first quarter of the previous downturn), Wyoming’s construction industry experienced a much greater over-the-year decline in total wages (-21.0%) than the statewide average (-1.2%). Wyoming’s construction industry continued to experience over-the-year decreases in employment and wage levels for several quarters after the end of the previous downturn: average monthly employment declined from previous year levels during every quarter from 2008Q1 to 2011Q4, and over-the-year changes in wages fluctuated between positive and negative throughout the same period. The construction industry showed employment and wage growth from 2012Q1 to 2015Q1, and then experienced an over-the-year decline in 2015Q2 and 2015Q3.
Educational & Health Services (NAICS 61 & 62)

|
Education & health services is a supersector industry comprised of educational services (NAICS 61) and health care & social assistance (NAICS 62). As explained by R&P (in press), “the population of the state is a large driver of health care employment; more people, especially older people, increase the demand for health care.” As shown in Figure 4, total wages and average monthly employment in educational & health services continued to increase even during the previous economic downturn. Even as Wyoming’s economy was contracting, health care & social assistance employers were still increasing the net number of jobs. This can also be seen during the most recent downturn, as total wages and average monthly employment grew from prior year levels in 2015Q2 and 2015Q3.
Conclusion
|
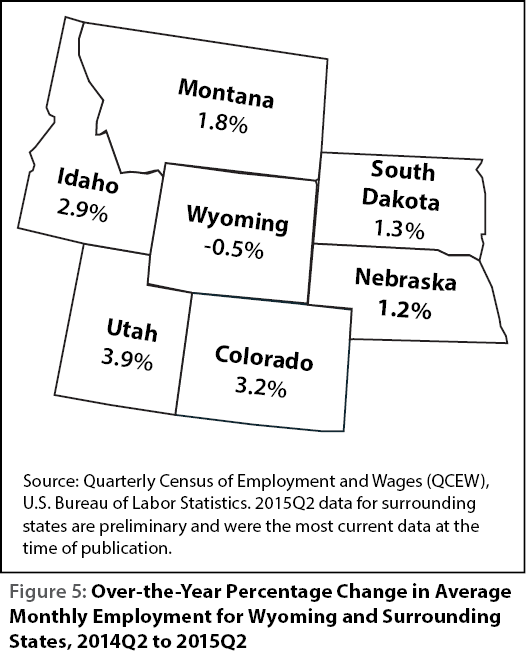
The circumstances surrounding the previous economic downturn and the most recent one are quite different. Wyoming’s previous economic downturn was preceded by the U.S. Great Recession, which lasted from December 2007 to June 2009 (NBER, 2010). By the time Wyoming’s economic downturn began in 2009Q1, most surrounding states had already experienced several quarters of decline in employment and wage levels. However, since 2012, most of the surrounding states experienced a greater rate of over-the-year growth in employment. Over-the-year employment growth for Colorado and Utah was around 3% and 4%, respectively, in 2015Q2, while Wyoming’s employment declined by 0.5% from 2014Q2 (see Figure 5). Employment and wage data for surrounding states for 2015Q3 were not available to R&P at the time this article was published.
Given the contraction of Wyoming’s economy and continued employment growth in surrounding states, it is entirely possible that displaced Wyoming workers may seek employment in states such as Colorado, Montana, and Utah. R&P will continue to monitor and publish quarterly wage and employment estimates in Wyoming Labor Force Trends and online at http://doe.state.wy.us/LMI/toc_202.htm.
References
Bullard, D. (2013). Local jobs and payroll in Wyoming: Construction continues to grow in 2012Q2. Wyoming Labor Force Trends, 50(1). Retrieved February 18, 2016, from http://doe.state.wy.us/LMI/trends/0113/qcew.htm
Bureau of Labor Statistics, U.S. Department of Labor. (2014). North American Industry Classification System (NAICS) at BLS. Retrieved February 12, 2016, from http://www.bls.gov/bls/naics.htm
National Bureau of Economic Research. (2010). Retrieved February 12, 2016, from http://www.nber.org/cycles/sept2010.html
Research & Planning, Wyoming Department of Workforce Services. (In press). Wyoming Workforce Innovation and Opportunity Act (WIOA) Unified Plan. Retrieved February 5, 2016.