Employment by Size Class and Industry
 |
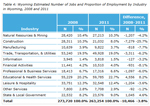 |
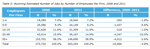
Tables 3 and 4 show the estimated numbers of jobs in Wyoming for 2008 and 2011 by employer size class and industry, respectively. Total employment fell by 10,466 from 2008 to 2011. The most jobs lost by size class were for firms with 20-49 employees (-4,347; -10.0%). Firms with 10-19 employees lost the fewest jobs at -318 or -1.0%. By industry the greatest numbers of jobs lost were in construction (-7,279; -25.7%) and trade, transportation, & utilities (-3,311; -6.2%). Two industries gained employment from 2008 to 2011: educational & health services and state & local government. The educational & health services industry added 4,556 jobs (8.2%), while state & local government added 1,045 jobs (4.6%).
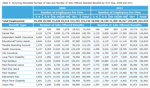 |
Total Wyoming employment and benefits offered to jobs by employer size class in 2008 and 2011 are shown in Table 5. The number of jobs offered benefits was highest for firms with 50 or more employees and lowest for firms with one to four employees regardless of benefit type. For example, in firms with 50 or more employees, 120,239 jobs were offered health insurance in 2008 and 114,558 jobs were offered the benefit in firms with 50 or more employees in 2011. In comparison, 5,147 jobs in firms with one to four employees were offered health insurance in 2008 and 4,496 jobs with one to four employees were offered the benefit in 2011. As will be illustrated later in this report, the proportion of jobs offered benefits is also higher for firms with more employees.
Previous: Survey Response Rates, Methodology, and Analysis Procedures | Next: Survey Results 2011