Benefits Time Series: Can We Determine If Employers Are Dropping Health Coverage?
Often Research & Planning (R&P) is asked if fewer employers are offering health insurance to their employees. To answer this question, R&P conducts the Benefits Survey. This survey is conducted on a quarterly basis and results are published annually. While it is possible to look at the annual results and see trends in the data, most of the time the year-to-year changes are not statistically significant. In other words, it could appear that fewer (or more) employers are offering benefits simply because a different group of employers was randomly selected for the survey that year. This article describes a supplemental benefits survey that was conducted in 2008 to try to determine if employers were dropping (or adding) health insurance coverage.
It should be noted that the incidence of benefits offering varies greatly by full-time and part-time status. Also, larger employers are much more likely to offer benefits than small employers. Employers in certain sectors (e.g., government, natural resources & mining, and educational & health services) also tend to offer more benefits. Wyoming's economy is highly seasonal, especially within certain sectors. Construction employment, for example, increases greatly during the spring and summer and then decreases in the fall and winter. Leisure & hospitality is another sector where employment tends to follow a regular seasonal pattern which peaks in the summer months. Thus, the industry composition of Wyoming's economy looks different in the peak of the summer (more jobs in construction and leisure & hospitality) than in the fall or winter. Within construction and leisure & hospitality there are many small employers, and high employee turnover might also contribute to a lack of benefits in these sectors.
Methodology
To better understand changes in employer-provided health coverage, R&P designed a supplemental benefits survey. Analysts randomly selected 100 employers who had responded to the benefits survey in fourth quarter 2007. In order to ensure that large, medium, and small employers were included, the subsample was stratified by size class. These 100 employers were re-contacted by phone in December 2008 and asked the same health insurance questions as in 2007. These questions included the number of full-time and part-time employees, whether the employer offered health insurance, the number of employees offered coverage, and the number who enrolled. Survey respondents were also asked questions about dependent health care coverage. This allowed analysts to compare health insurance offerings in November 2008 to offerings a year earlier from the exact same employers, and thus develop a time series.
Analysts chose the number 100 in order to make the workload of phone calls manageable in the time that was available without interrupting regular data collection for the ongoing quarterly benefits survey.
Results
Of the 100 firms selected, two had closed and were no longer in business in December 2008 and analysts were unable to contact one employer. Thus, 97 employers were contacted and successfully completed the survey.
The data in Table 1 are based on the matched sample of 97 employers. It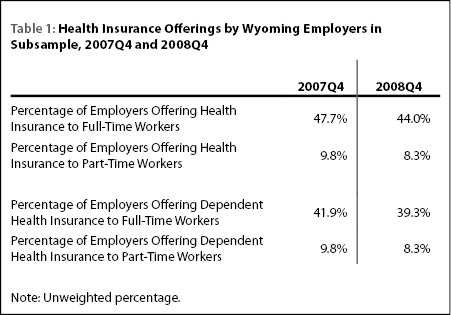 shows that among the firms in the subsample, there was a slight decrease in the percentage of employers offering health insurance to their full-time workers (44.0% in fourth quarter 2008 compared to 47.7% in fourth quarter 2007). Employers were also slightly less likely to offer health insurance to part-time workers in 2008 than in 2007.
The percentage of employers offering health coverage for their full-time workers' dependents fell from 41.9% in fourth quarter 2007 to 39.3% in fourth quarter 2008. Similarly, the number of employers offering dependent health coverage to part-time workers decreased slightly.
While Table 1 shows what happened in the aggregate of the
matched sample of employers, it does not give any detail on whether individual employers added or dropped insurance coverage.  Table 2 was created to provide that detail on sampled employers. It shows that of the 79 employers who had full-time employees in both 2007Q4 and 2008Q4, the vast majority (72, or 91.1%) did not add or drop insurance coverage for those full-time workers. A small number of employers (2, or 2.5%) added insurance coverage between 2007Q4 and 2008Q4, while a handful (5, or 6.3%) dropped coverage.
Time Series: A Methodological Note
When trying to estimate the change in a variable at two different points in time, it is often helpful to have a time series, or a longitudinal data set. If, for example, analysts were to independently draw two samples at Time 1 and Time 2 and measure some variable (e.g., the unemployment rate, or the incidence of employer-provided health insurance), much of the difference between observations could be the result of sampling error. Even if it appeared that the variable had changed, the level of sampling error would make it difficult to reject the null hypothesis of no change. An alternate (and better) method would be to draw one sample and measure the variable at time 1 and again at time 2. This reduces sampling error for the difference. One drawback of this approach is the higher respondent burden (each member of the sample must report twice). In order to reduce the error in over-the-month and over-the-year changes in the unemployment rate, the Current Population Survey (CPS) design mandates that 75% of the sample overlaps from month to month and 50% of the sample overlaps from year to year (Bureau of Labor Statistics, 2010).
It may be important to note that Wyoming's economy was expanding during 2007 and 2008. The results obtained during a period of strong growth may be different from those during a period of contraction, or of only modest growth.
In summary, survey results suggested that the overall percentage of employers offering health insurance fell very slightly from fourth quarter 2007 to fourth quarter 2008. However, some employers added coverage, partially offsetting the employers who dropped coverage. The vast majority of employers neither dropped nor added coverage.
Because of the small sample size, breakouts of results by industry, region, or size-class would not be meaningful.
Conclusion
In order to develop effective public policy, it is important to understand the incidence of benefits offering by Wyoming employers. It is also important to know if the mix of benefits is changing over time. This research project demonstrated that it is possible to create a longitudinal time series of the benefits offerings of a select group of Wyoming employers. In light of this finding, it might be worthwhile to modify the design of the current quarterly benefits survey to include the collection of longitudinal data. However, along with the advantages of such a data set, future researchers should not forget the respondent burden (and possible negative impact on response rates) created by re-contacting employers more frequently.
Senior Economist David Bullard can be reached at (307) 473-3810 or dbulla@state.wy.gov.
Acknowledgements
Margaret Hiatt, Administrative/Survey Support Specialist, made all the phone calls and collected all the data.
Senior Economist Doug Leonard drew the random sample of 100 employers from those that responded to the fourth quarter 2007 survey.
References
Bureau of Labor Statistics (2010). "Explanatory notes and estimates of error." Employment and Earnings 57(11), Retrieved December 14, 2010 from http://stats.bls.gov/opub/ee/empearn201011.pdf