Indicators of Wyoming’s Economic Health: Part I
The movement of workers from their homes to their places of employment is an integral part of Wyoming’s economy. A considerable amount of movement is due to the state’s low population density and the existence of work locations in remote areas. The following article examines the relationship of worker commuting to other economic variables such as initial unemployment insurance claims, jobs worked, and oil and gas drilling activity. Research indicated that commuting as a factor in conjunction with other variables can be a leading indicator of employment changes in the state.
“On an over-the-year basis, employment fell by 3,059 jobs (-1.1%) and average weekly wage decreased by $1 (-0.1%) from first quarter 2008 to first quarter 2009. Job losses were reported in more than half of Wyoming counties and in 12 industry sectors.” (Bullard & Brennan; October 2009)
As the quote indicates, Wyoming’s economy entered a period of contraction during first quarter 2009. This stands in stark contrast to the rapid growth the state experienced from 2005 to 2008. Once a contraction begins, speculation follows as to whether (and to what extent) downturns can be anticipated and what data are available to either predict or confirm these events. Wyoming’s rapid growth in recent years also had other effects on workers in the state. The rural nature and sparsely populated open spaces in the state require some type of work-related travel for many people. This increases demand for fuels, automotive repair, and automotive maintenance. More demands are placed on the infrastructure as well when people use public roadways for work. As trip distances and frequencies increase, so do the chances traveling workers will be involved in automobile accidents. Additional time on the road means less time spent at home, which may be associated with family life difficulties. Positive impacts of workers commuting may include the ability to secure higher paying and more stable employment while remaining at the same residence.
Prior analyses performed by Research & Planning focused on the socioeconomic impacts associated with commuting during an economic expansion (Leonard, 2008). However, limited research examined what happens to worker commuting during an economic contraction or recession. In addition to commuting effects, what other variables could be used to analyze the severity of, and, if possible to predict economic downturns before they occur?
The primary data set and definitions used in this analysis come from the commuting pattern data model (Leonard, 2008). This data set contains information about worker movements, wages, industries, and demographics. Other data sets used include continued and initial unemployment insurance (UI) claims (Wyoming Department of Employment, 2009), rotary drilling rig counts (Baker Hughes, Inc., 2009) and employment levels from the Quarterly Census of Employment and Wages (QCEW) program (Wyoming Department of Employment, 2009).
The base unit of analysis was jobs worked at any time in the state, not individuals working. This means that the analysis of commuting count and distance data includes multiple jobholding. The analysis covers the period from first quarter 2001 to first quarter 2009.
Results
Figure 1 shows the quarterly intracounty
(short distance, within county) 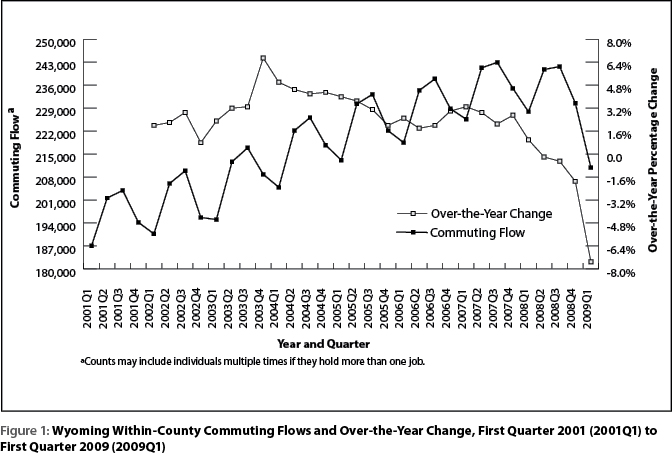 commuting flows from first quarter 2001
to first quarter 2009 along with the percentage change in flow compared
with the prior year. The over-the-year percentage change line provides
information regarding positive or negative growth in Wyoming’s economy.
As the positive portion of the growth line shows, changes were small
(3.2% or less) until fourth quarter 2003, when intracounty commuting
surged 6.7% to 208,850 worker transactions (single and multiple jobs)
from 195,679 in fourth quarter 2002. From fourth quarter 2003 until second
quarter 2005 (seven quarters) the growth rate in intracounty commuting
was nearly equal to or exceeded 4.0%. From third quarter 2005 to fourth
quarter 2007, the growth rate slowed but remained steady between 1.8%
and 3.1%. However, beginning in first quarter 2008, growth in intracounty
commuting slowed rapidly and became negative by second quarter 2008.
The last three quarters in the time series show a rapid decline in intracounty
commuting through first quarter 2009 as the recession which beset the
United States appears to begin substantially affecting Wyoming.
commuting flows from first quarter 2001
to first quarter 2009 along with the percentage change in flow compared
with the prior year. The over-the-year percentage change line provides
information regarding positive or negative growth in Wyoming’s economy.
As the positive portion of the growth line shows, changes were small
(3.2% or less) until fourth quarter 2003, when intracounty commuting
surged 6.7% to 208,850 worker transactions (single and multiple jobs)
from 195,679 in fourth quarter 2002. From fourth quarter 2003 until second
quarter 2005 (seven quarters) the growth rate in intracounty commuting
was nearly equal to or exceeded 4.0%. From third quarter 2005 to fourth
quarter 2007, the growth rate slowed but remained steady between 1.8%
and 3.1%. However, beginning in first quarter 2008, growth in intracounty
commuting slowed rapidly and became negative by second quarter 2008.
The last three quarters in the time series show a rapid decline in intracounty
commuting through first quarter 2009 as the recession which beset the
United States appears to begin substantially affecting Wyoming.
Figure 2 illustrates commuting behavior
in a slightly different manner than 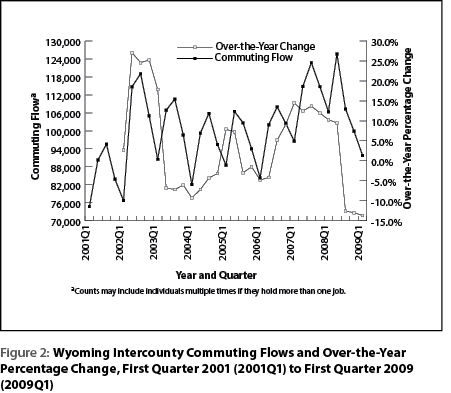 Figure 1. First, Figure 2 shows commuting
behavior between counties (intercounty commuting). Second, in addition
to Wyoming residents, it includes people working in the state who do
not have a Wyoming driver’s license (nonresidents). In 2002 there was
a rapid increase in the amount of intercounty commuting, followed by
several quarters of contractions occurring in the period shortly following
the collapse of Enron. This was followed by a period of growth in the
first half of 2005 transitioning back to negative growth from third quarter
2005 until second quarter 2006. From second quarter 2006 until second
quarter 2008 growth rates exceeded 12.0% four times. The effects of the
national recession can be seen in third quarter 2008 as intercounty commuting
contracted at a pace greater than 12.0%.
Figure 1. First, Figure 2 shows commuting
behavior between counties (intercounty commuting). Second, in addition
to Wyoming residents, it includes people working in the state who do
not have a Wyoming driver’s license (nonresidents). In 2002 there was
a rapid increase in the amount of intercounty commuting, followed by
several quarters of contractions occurring in the period shortly following
the collapse of Enron. This was followed by a period of growth in the
first half of 2005 transitioning back to negative growth from third quarter
2005 until second quarter 2006. From second quarter 2006 until second
quarter 2008 growth rates exceeded 12.0% four times. The effects of the
national recession can be seen in third quarter 2008 as intercounty commuting
contracted at a pace greater than 12.0%.
A comparison of over-the-year changes in statewide employment
(Wyoming Department of Employment, 2009), intercounty commuting, initial
(first-time filing) unemployment insurance (UI) claims (Wen & Leonard,
2009), out-of-state UI claimants (Leonard, 2009), and rotary drilling
rig counts 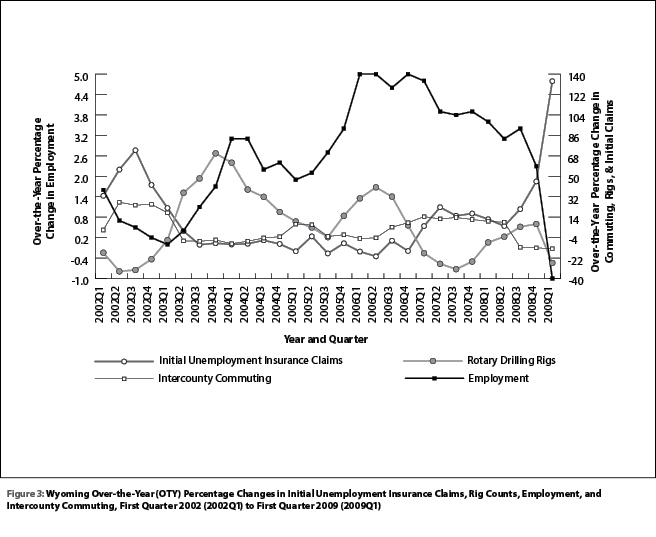 (Baker Hughes, 2009) is shown in Figure
3. Changes
in intercounty commuting, either up or down, do not necessarily precede
changes in the employment level. An example of this occurred in 2007,
when intercounty commuting increased, yet the employment growth levels
declined. Over-the-year percentage changes in initial filings for unemployment
insurance and rotary drilling rig counts do appear to precede changes
in employment. When initial UI claims and rig counts changed markedly
compared to the recent historical trend in 2007 and 2008, the employment
growth rate began to decline. It was not until first quarter 2009 that
the state began to experience negative employment growth.
(Baker Hughes, 2009) is shown in Figure
3. Changes
in intercounty commuting, either up or down, do not necessarily precede
changes in the employment level. An example of this occurred in 2007,
when intercounty commuting increased, yet the employment growth levels
declined. Over-the-year percentage changes in initial filings for unemployment
insurance and rotary drilling rig counts do appear to precede changes
in employment. When initial UI claims and rig counts changed markedly
compared to the recent historical trend in 2007 and 2008, the employment
growth rate began to decline. It was not until first quarter 2009 that
the state began to experience negative employment growth.
Discussion
The rapid decline in intercounty commuting (see Figures
2 and 3) beginning in mid-2008 suggests the over-the-year change statistic
(in conjunction with other variables) could be used as a leading indicator
of growth or contraction in Wyoming’s economy. Intracounty commuting
flows (see Figure 1) show that the current recession is much different
than the economic downturn Wyoming experienced earlier in the decade.
During that downturn, intracounty commuting flows were affected very
little, while a much larger downward change was observed in intercounty
commuting. Often during economic expansions, Wyoming obtains a large
amount of labor from other states (Jones, 2006). When expansions end,
these workers generally return to their locations of origin (see Figure
4). Figure 4 shows 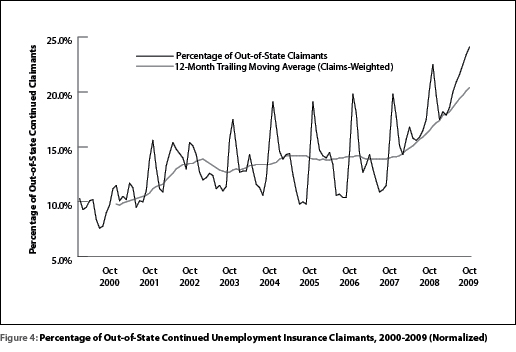 that during the current recession, nearly one-quarter
of dislocated workers receiving Wyoming unemployment benefits are now
living in another state. Based on the data presented in Figures 1 and
4, the current recession is affecting Wyoming’s resident workforce in
addition to its itinerant or transient workforce.
that during the current recession, nearly one-quarter
of dislocated workers receiving Wyoming unemployment benefits are now
living in another state. Based on the data presented in Figures 1 and
4, the current recession is affecting Wyoming’s resident workforce in
addition to its itinerant or transient workforce.
Although commuting data provide some information regarding economic health, UI claims and rotary drilling rig count data are timelier and tend to be more sensitive to economic changes. This is evidenced in Figure 3 when the rig counts and UI claims began moving in opposite directions beginning in 2007, well before the decline in employment was seen in first quarter 2009. Conversely, the timeliness and sensitivity of these data sets may be early indicators of Wyoming’s recovery, while intercounty commuting data may be more confirmatory in nature.
Conclusion
In this first article of a two-part series, we examined the interplay between commuting flows, rotary drilling rig counts, first-time applications for unemployment insurance, and employment levels. The combination of these four data sets showed an early indication of Wyoming’s economic downturn. Such indicators may also provide information as to when the state has exited the recession and is on the path toward recovery.
References
Baker Hughes, Inc. (2009). Rotary rigs by state. Retrieved October 22, 2009, from http://investor.shareholder.com/bhi/rig_counts/rc_index.cfm
Bullard D. & Brennan N. (2009). Covered employment and wages for first quarter 2009: Jobs and payroll decrease from year-ago levels. Wyoming Labor Force Trends, 46(10). Retrieved November 10, 2009 from http://doe.state.wy.us/LMI/1009/1009.pdf
Jones, S.D. (2006). States of origin for Wyoming workers. Wyoming Labor Force Trends, 43(4). Retrieved November 10, 2009 from http://doe.state.wy.us/LMI/0406/a1.htm
Leonard, D.W. (2009). Out of State Continued Unemployment Insurance Claimants, 2000-2009 (Normalized). Unpublished chart.
Leonard, D.W. (2008). Laramie County and Colorado worker commuting pattern analysis. Retrieved October 12, 2009, from http://doe.state.wy.us/LMI/cheyenne_mpo_08.pdf
Wen, S. & Leonard, D. (2009). Statewide normalized initial claims by industry in NAICS. Retrieved October 21, 2009, from http://doe.state.wy.us/LMI/ui/UI_tables.xls
Wyoming Department of Employment, Research & Planning (2009). Quarterly Census of Employment and Wages.