© Copyright 2006 by the Wyoming Department of Employment, Research & Planning
Vol. 43 No. 4
By examining decennial census information, Research & Planning found strong evidence that nonresidents are becoming an increasingly large percentage of Wyoming’s population. Although Wyoming had a relatively low population growth rate, few states had a higher percentage of new residents. Also, the majority of those who left the state were between the ages of 25 and 34, which suggests the aging of the state’s population and its reliance on nonresident labor is likely to continue. In order to fill the state’s labor needs, recruiters will need to focus their efforts on attracting and retaining permanent residents, not just workers.
With substantial projected job growth and an aging workforce moving toward retirement, attracting workers to Wyoming and keeping them here has become a primary concern. In the December 2005 issue of Wyoming Labor Force Trends, Tom Gallagher explored the question of the state of origin for nonresident Wyoming Construction and Natural Resources & Mining workers. This article further examines which states contribute the largest number of individuals to our workforce and which states contribute workers who are most likely to stay and become residents of Wyoming.
There is strong evidence to suggest that nonresidents are becoming an increasingly large percentage of our population (Glover, 2005). There has also been considerable discussion about the exodus of younger residents (Jones, 2005; Saulcy 2004). The scope of the problem is difficult to explain. Most people see that the economy is continuing to grow, jobs are being created, and for the most part, those jobs are being filled. What people do not see, however, are the underlying dynamics of the population.
At every decennial census, information is gathered regarding where individuals lived 5 years prior. That information is later presented as part of the U.S. Census Bureau’s Summary File 3. We used this information to order the states according to the percentage of their population age 5 and older in 2000 which did not live in that state in 1995. In other words, the states were ordered according to their percentage of new residents. Nevada (see Table 1) had the largest number of individuals over age 5, who had relocated to the state between 1995 and 2000. As such, Nevada was given an order number of 51 (includes the District of Columbia).
Table 1 also shows the states ordered on population growth between 1995 and 2000. Nevada, again, was given the highest number because its population growth was larger than any other state’s (see Figure). The graph shows most of the states lie along the center of the distribution. This means that they were ordered very similarly on both population growth and percentage of new residents. Nevada, for instance, was ranked highest on both measures.
On the other hand, Wyoming (along with Hawaii and the District of Columbia) is plotted below the majority of other states. These states had a high percentage of new residents but low population growth. Specifically, between 1995 and 2000, the net population growth of Wyoming was only 16,307 (or 3.7%), making it the 8th lowest state for population growth. However, only six states had a higher percentage of new residents. Over the same years, 78,071 people moved into the state, but the total number of residents grew by only 16,307. This equates to a net of 61,764 people leaving the state during the second half of the decade. Essentially this means that for every new Wyoming resident, five people were needed in order to compensate for attrition.
The out-migration during the period 1995-2000 affected more than the population estimate. Rather than being uniformly distributed among the age groups, the majority of those who left the state were between the ages of 25 and 34 (Gallagher, 2003). The result was a resident population in Wyoming older than the U.S. average. The significance of an older population distribution is becoming clear. The proportion of residents approaching retirement age is increasing while the share of younger residents is decreasing. Reliance on nonresident labor is rising and will likely continue to rise over coming years. If the trend of requiring five people in order to retain one continues, Wyoming could face an unprecedented labor shortage within the next 10 years.
Workers
In this light, recruiting labor is more important than ever. Part of the process is understanding who to recruit. We need to understand not only who will come to Wyoming but also who will stay. There are several factors involved in a successful relocation. People tend to move to (and stay in) places they are comfortable. Family ties, similar geography and climate, and similar area demographics are important. Individuals from Miami, a highly populated, ethnically diverse city situated next to the ocean, will likely experience difficulties adjusting to Wyoming. For these reasons it seems likely that recruitment efforts would be most successful in surrounding states.
Table 2 shows Internal Revenue Service (IRS) internal migration data for 2003-2004. Migration data show from where new residents move. Most of those who move to Wyoming and stay long enough to file their taxes in the state come from Colorado, California, Utah, Montana, and Texas. This is similar to the state of origin found for workers in Wage Records. The number of exemptions claimed represents an estimate of the total number of new residents associated with each tax return.
Table 3 lists the states of origin for all of Wyoming’s workers in 2004. The state of origin is defined as the state which issued the individual’s social security number and is denoted by the first 3 digits. Residency is defined by the joint research of Wyoming and several other states (Jones, 2004).
As seen in the table, over half of the workers (52.5%) were Wyoming natives (their social security numbers were issued in Wyoming.) The rest represented all of the U.S. states and territories. Of workers born in states other than Wyoming, those from Nebraska or North Dakota were the most likely to become residents of Wyoming. For both states, 80.5% of individuals who moved to Wyoming became residents. Iowa was almost as high, with 80.2% of migrating workers becoming residents. Only three of Wyoming’s bordering states are represented in the top 10: Nebraska, South Dakota, and Montana.
At the other end of the spectrum, workers from the U.S. territories of Puerto Rico (25.6%) and the Virgin Islands (10.2%) were the least likely to become Wyoming residents. Washington D.C. and Mississippi followed closely with less than half (40.8% and 49.5%, respectively) becoming residents. Table 4 lists the 20 states from which the most nonresident workers in 2004 originated. The highest was California, which contributed 7,221 workers. Colorado’s contribution to Wyoming’s workforce (4,861) was nearly 35% less than that of California, but the highest among Wyoming’s bordering states. All of the bordering states are represented in the top 10, along with Texas, Arizona, and Washington.
Table 5 is the same as Table 4 except it is ranked by the number of nonresident workers who eventually became permanent residents. Colorado, a border state, is the largest source state for new residents with 12,625 workers. California follows closely at 12,362. All of the states surrounding Wyoming are in the top 5, with the exception of Idaho, which contributes the 11th highest number of residents (3,515).
When considering where to recruit workers, it is important to understand that getting workers to Wyoming is not the same as gaining new permanent residents. States that contribute considerable numbers of workers are not necessarily the states that contribute the most long-term residents. Workers from Texas and Arizona, states from which large numbers of workers originated, were about as likely to work in Wyoming and then leave the state as they were to become residents. Perhaps a better recruitment strategy would be to focus on states with large numbers of contributed workers that also have a high percentage who become residents, such as Nebraska or South Dakota.
References
Gallagher, T. (2003). Chapter 1: Economic assumptions and the use of projections data. In S. Murray and K. R. Shinkle (Eds.) Employment outlook: 2010. Casper WY: Wyoming Department of Employment, Research & Planning.
Glover, W. (2005). Using Labor Pool Migration Data to Retain Businesses and Attract Prospective Employers. Wyoming Labor Force Trends, 42(7), 1-9.
Jones, S. D. (2005). Labor retention: Out-migration of youth. Wyoming Labor Force Trends, 42(6), 1-6.
Jones, S. D. (2004). Worker residency determination – Wyoming stepwise procedure. Retrieved March 14, 2006, from: http://doe.state.wy.us/LMI/0804/a1supp.htm
Saulcy, S. (2004). Where are they now? Wyoming community college graduates’ labor market outcomes 2004. Casper, WY: Wyoming Department of Employment, Research & Planning.
Return to text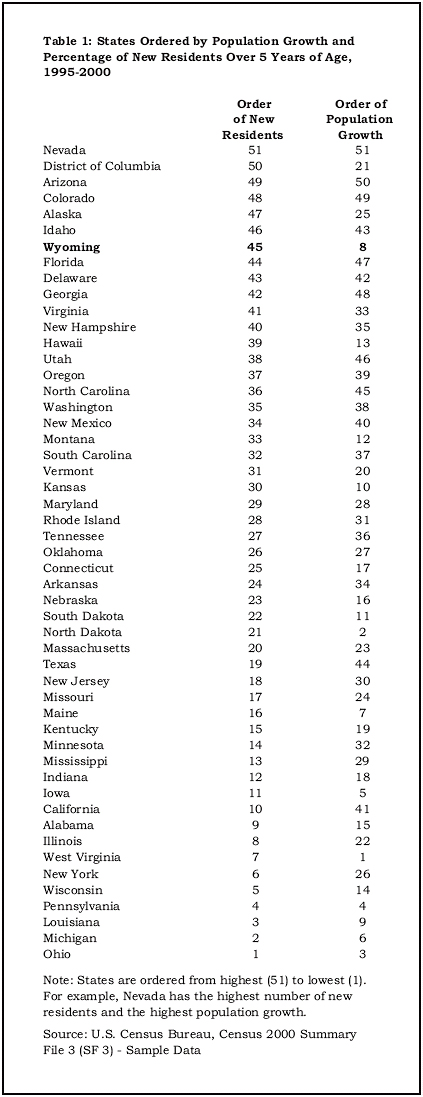
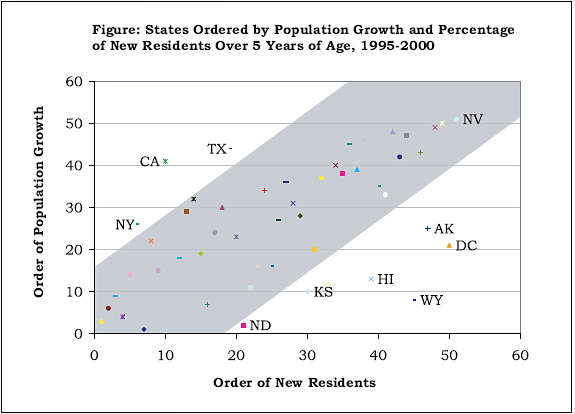
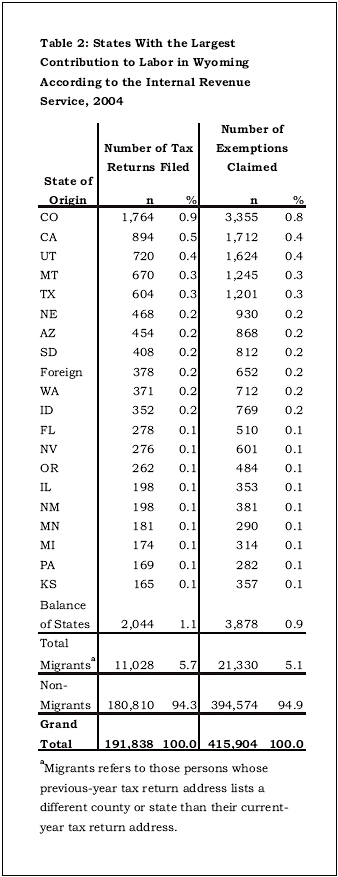
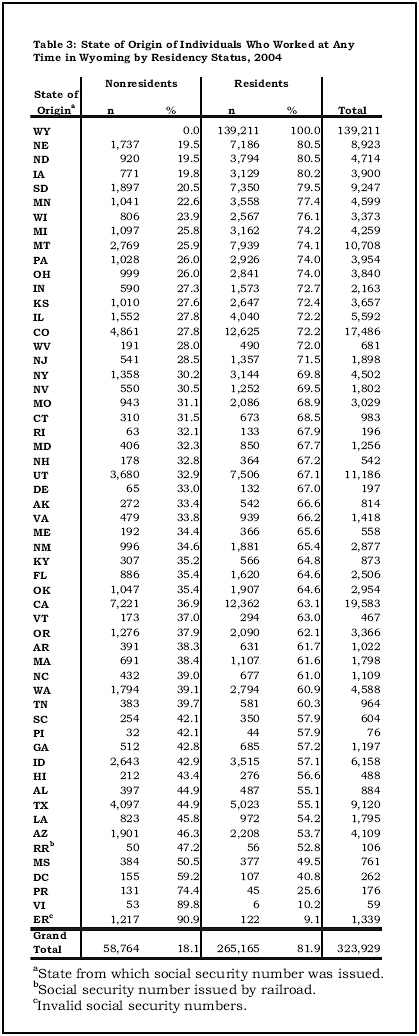
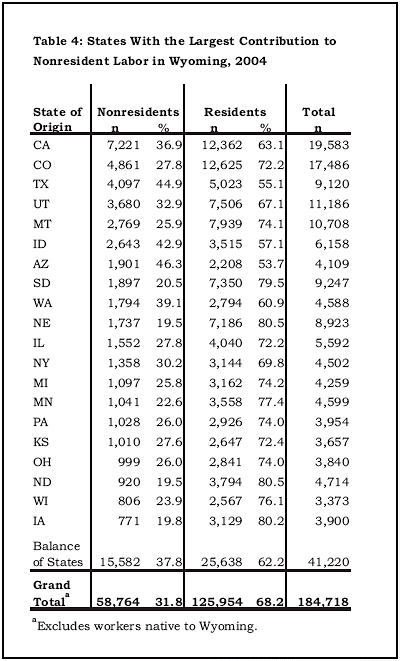
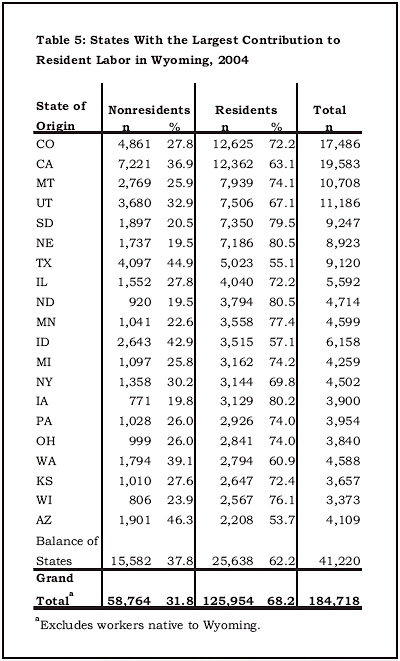
Table of Contents | Labor Market Information | Wyoming Job Network | Send Us Mail
These pages designed by Julie Barnish.
Last modified on
by Phil Ellsworth.