Wyoming IMPLAN Analysis of ARRA Spending
The purpose of this research was to demonstrate the use of IMPLAN modeling software in estimating the economic impact of a specific American Recovery and Reinvestment Act (ARRA) project performed in Wyoming. This work occurred as part of a multi-state (South Dakota, Iowa, Montana, Nebraska, Wyoming, and Utah) collaboration to estimate the impacts of ARRA spending (among other objectives) in those respective states. No selection criteria were used for the project analyzed other than the activity occurred in Wyoming and was performed as a result of an ARRA grant. Although the project analyzed was part of the ARRA Clean Diesel Program, the funding for the impact research was not. Nor was the research funded through the grant awarded to DEQ and its subcontractors to perform the work. The Research & Planning (R&P) section of the Wyoming Department of Employment has used IMPLAN for a variety of projects including the estimation of impacts due to Unemployment Insurance claims payments and power plant construction. Some data elements were suppressed to maintain employer and worker confidentiality.
Method Section I – Input Assumptions

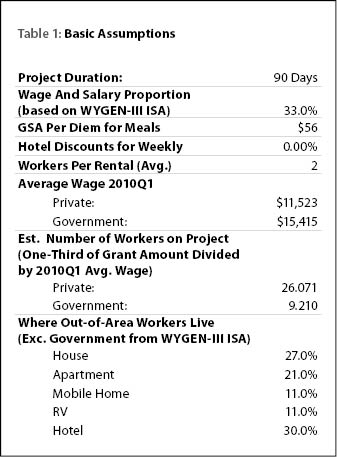
Wyoming's basic assumptions for the project are contained in Table 1. From the ARRA database, the project was scheduled to begin in first quarter 2010 and be completed in that quarter. Therefore, the project duration was 90 days. To properly allocate grant amounts to the various economic sectors, R&P had to know what proportion of the revenue (grant amounts in this case; see Table 2) consisted of wages and salaries. The 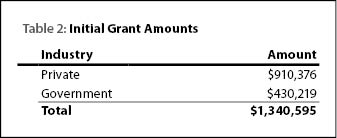 WYGEN-III industrial siting application (ISA) indicated this proportion was approximately 33% for construction projects (CH2M Hill, 2010). Dividing the wage and salary amounts in each industry by the average wage paid in each industry during first quarter 2010, R&P developed estimates of the number of jobs created or supported by the project in each industry. These numbers will be used later for housing and food spending by out-of-county workers. The housing breakouts also came from the WYGEN-III ISA (CH2M Hill, 2010). This ISA was used rather than those associated with wind power because it seems to be more closely matched to that type of project than a wind power project. No dollar deductions were made to the government portion of the project as all of that activity was assigned to the multi-county analysis area.
To adjust for worker commuting, R&P used the commuting pattern 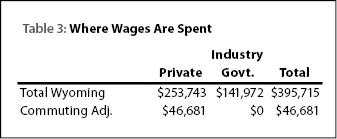 estimates from fourth quarter 2009 for the specific employers included in the grants, not the industries in which they operate. The data showing distribution of wages paid by residence were suppressed for confidentiality reasons. Using the amount of wages
 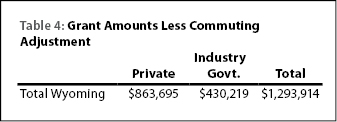 calculated in the basic assumptions, wages were allocated to the various counties where those firms' workers reside (see Tables 3 and 4).
The estimates of housing impacts (see Table 5) were calculated using the  estimated number of workers and the proportions using each type of housing in combination with the distribution of wages paid by residents (suppressed data) in addition to Sublette County average rents (Wyoming Community Development Authority, 2010). These amounts were also subtracted from the gross grant amounts. The meal calculations
  shown in Table 6 were performed in much the same manner as the housing estimates in Table 5 but instead used the meal per diem cost from Table 1 rather than Sublette County estimated rents (General Services Administration, 2010). These expenditures do
  not funnel through the industries but through the households supported by the expenditures. Table 7 contains the estimates of monies which actually flow through those firms for material purchases, upkeep, and local worker wages.
Method Section II – IMPLAN Execution
R&P used the model assumptions and calculations (Method Section I ![]() above) to develop the inputs for Table 8. Although multiple private sector firms and industry sectors were involved in the project, all private sector activity was combined into one category for the purposes of this report. The final dollar amounts are the initial grant amounts less commuter wage, meal, and housing adjustments.
above) to develop the inputs for Table 8. Although multiple private sector firms and industry sectors were involved in the project, all private sector activity was combined into one category for the purposes of this report. The final dollar amounts are the initial grant amounts less commuter wage, meal, and housing adjustments.
Results
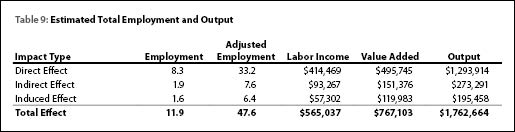
The results of the model are shown in Table 9. At first glance the ![]() employment calculations for the project appeared quite low. Estimates of employment change used in the worksheet based on the proportion of project funds accounted for by wages and salaries and the average QCEW wage was approximately 35. However, IMPLAN assumes the project takes an entire year to complete while the estimated project timeline was one quarter. While the labor income, value added, and total output dollar amounts are correct, the employment estimate is one-fourth of the actual level. Therefore, all employment estimates must be multiplied by four to account for the difference. Techniques to adjust IMPLAN dollar inputs and/or employment outputs to account for project time spans are not unusual.
employment calculations for the project appeared quite low. Estimates of employment change used in the worksheet based on the proportion of project funds accounted for by wages and salaries and the average QCEW wage was approximately 35. However, IMPLAN assumes the project takes an entire year to complete while the estimated project timeline was one quarter. While the labor income, value added, and total output dollar amounts are correct, the employment estimate is one-fourth of the actual level. Therefore, all employment estimates must be multiplied by four to account for the difference. Techniques to adjust IMPLAN dollar inputs and/or employment outputs to account for project time spans are not unusual.
For example, the Wygen III ISA states, "10. Because the IMPLAN model is a short-term annual model, the construction analyses are evaluated for a one-year period. Then all costs are averaged over the 29-month construction duration and multiplied by 12 months to arrive at an annual estimate of potential changes to the county's economy." (CH2M Hill, 2010, page 3-36.)
The adjusted employment figures are shown in the second column of Table 9. The 33.2 estimated direct jobs created or sustained by the project is very close to the amount calculated when the out-of-state wages are removed (33.9). The model estimates indicate that for each direct job created in the project, 0.43 additional jobs were created as a result of business to business purchases and increases in household expenditures. Where output is concerned, each $1 spent on the project resulted in $1.36 in increased economic activity in the region of interest (Campbell, Laramie, Lincoln, Natrona, Sublette, and Sweetwater counties).
The breakdown of employment and economic output added (with adjusted employment values) is shown in Table 10. The top 10 industries shown accounted for 82.3% of the total employment added.
Conclusion
The results indicate a jobs multiplier of 1.43 and an output multiplier of 1.31 for this project, assuming its one-quarter completion time horizon as proposed. The output multiplier calculation was based on the gross grant amount. This multiplier would be 1.36 if based on the net grant amount impacting the study area. The level of calculated employment impact is an upper-limit estimate because the Recovery.gov website indicated the project was still in progress (more than 50%) into second quarter 2010. The output multipliers would be unaffected as long as project completion occurs in 2010.
References
CH2M Hill (2010). Wyoming Industrial Development Information and Siting Act Application Permit: Wygen III Campbell County, Wyoming. Retrieved September 3, 2010 from http://deq.state.wy.us/isd/downloads/
WyGenIII%20Application%2010-19-07.pdf
Forney, Hazel: Sublette County Visitor Center. (2010). Average hotel rates for the Pinedale, WY area. E-mail communication August 27, 2010.
Recovery.gov (2010). Track the Money. Retrieved August 27, 2010 from http://www.recovery.gov/Transparency/RecipientReportedData/
Pages/RecipientProjectSummary508.aspx?AwardIDSUR=
18351&AwardType=Grants
United States General Services Administration (2010). Per Diem Rates Overview. Retrieved September 1, 2010 from http://www.gsa.gov/portal/category/100120
Wyoming Community Development Authority (2009). Wyoming Housing Database Partnership: Revised Final Report August 31, 2009. Retrieved September 1, 2010 from http://www.wyomingcda.com/files/Sublette09.pdf
Wyoming Department of Employment, Research & Planning. (2010). Commuting Patterns Data Model. Unpublished raw data.
Wyoming Department of Employment, Research & Planning (2010). Quarterly Census of Employment and Wages. Unpublished raw data.