Economic Indicators
by: Margaret Hiatt, Administrative/Survey Support Specialist
Wyoming unemployment insurance benefits paid decreased
by 36.6% from June 2009 to June 2010.
|
|
|
|
June |
May |
June |
Percent Change |
|
|
|
|
2010 |
2010 |
2009 |
Month |
Year |
|
|
|
|
_(p)_ |
_(r)_ |
_(b)_ |
_____ |
_____ |
| |
|
|
|
|
|
|
| Wyoming Total Civilian Labor Force(1) |
|
295,701 |
291,337 |
300,129 |
1.5 |
-1.5 |
|
|
Unemployed |
|
19,144 |
19,853 |
19,166 |
-3.6 |
-0.1 |
|
|
Employed |
|
275,957 |
271,484 |
280,963 |
1.6 |
-1.8 |
| Wyoming Unemployment Rate/Seas. Adj. |
|
6.5%/6.8% |
6.8%/7.0% |
6.4%/6.5% |
N/A |
N/A |
| U.S. Unemployment Rate/Seas. Adj. |
|
9.6%/9.5% |
9.3%/9.7% |
9.7%/9.5% |
N/A |
N/A |
| U.S. Multiple Jobholders |
|
6,899,000 |
7,261,000 |
7,067,000 |
-5.0 |
-2.4 |
|
As a percent of all workers |
|
4.9% |
5.2% |
5.0% |
N/A |
N/A |
| U.S. Discouraged Workers |
|
1,207,000 |
1,083,000 |
793,000 |
11.4 |
52.2 |
| U.S. Part Time for Economic Reasons |
|
8,867,000 |
8,513,000 |
9,301,000 |
4.2 |
-4.7 |
|
|
|
|
|
|
|
|
|
| Hours & Earnings for Production Workers |
| Wyoming Manufacturing Hours & Earnings |
|
|
|
|
|
|
|
Average Weekly Earnings |
|
$778.51 |
$806.41 |
$810.84 |
-3.5 |
-4.0 |
|
Average Weekly Hours |
|
39.2 |
40.1 |
40.3 |
-2.2 |
-2.7 |
| U.S. Manufacturing Hours & Earnings |
|
|
|
|
|
|
|
Average Weekly Earnings |
|
$760.35 |
$767.56 |
$720.56 |
-0.9 |
5.5 |
|
Average Weekly Hours |
|
41.1 |
41.4 |
39.7 |
-0.7 |
3.5 |
|
|
|
|
|
|
|
|
|
| Wyoming Unemployment Insurance |
|
Weeks Compensated |
|
32,271 |
32,116 |
47,876 |
0.5 |
-32.6 |
|
Benefits Paid |
|
$10,682,087 |
$10,668,445 |
$16,845,399 |
0.1 |
-36.6 |
|
Average Weekly Benefit Payment |
|
$331.01 |
$332.18 |
$351.85 |
-0.4 |
-5.9 |
|
State Insured Covered Jobs (1) |
|
273,479 |
265,485 |
271,204 |
3.0 |
0.8 |
|
Insured Unemployment Rate |
|
2.5% |
3.4% |
3.3% |
N/A |
N/A |
|
|
|
|
|
|
|
|
|
| Consumer Price Index (U) for All U.S. Urban Consumers |
| (1982 to 1984 = 100) |
|
|
|
|
|
|
|
All Items |
|
218.0 |
218.2 |
215.7 |
-0.1 |
1.1 |
|
|
Food & Beverages |
|
219.6 |
219.7 |
218.0 |
-0.1 |
0.7 |
|
|
Housing |
|
216.8 |
216.0 |
218.1 |
0.4 |
-0.6 |
|
|
Apparel |
|
118.3 |
121.0 |
118.8 |
-2.2 |
-0.4 |
|
|
Transportation |
|
192.7 |
194.8 |
183.7 |
-1.1 |
4.9 |
|
|
Medical Care |
|
388.2 |
387.8 |
375.1 |
0.1 |
3.5 |
|
|
Recreation (Dec. 1997=100) |
|
113.8 |
113.7 |
114.6 |
0.1 |
-0.7 |
|
|
Education & Communication (Dec. 1997=100) |
|
129.3 |
129.3 |
126.5 |
0.0 |
2.2 |
|
|
Other Goods & Services |
|
390.9 |
379.7 |
370.6 |
3.0 |
5.5 |
|
|
|
|
|
|
|
|
|
| Producer Prices (1982 to 1984 = 100) |
|
All Commodities |
|
183.7 |
185.0 |
174.1 |
-0.7 |
5.5 |
|
|
|
|
|
|
|
|
|
| Wyoming Building Permits (New Privately Owned Housing Units Authorized) |
|
Total Units |
|
209 |
160 |
166 |
30.6 |
25.9 |
|
|
Valuation |
|
$57,765,000 |
$32,593,000 |
$35,201,000 |
77.2 |
64.1 |
|
Single Family Homes |
|
148 |
107 |
137 |
38.3 |
8.0 |
|
|
Valuation |
|
$53,189,000 |
$25,485,000 |
$32,586,000 |
108.7 |
63.2 |
|
Casper MSA(2) Building Permits |
|
20 |
14 |
18 |
42.9 |
11.1 |
|
|
Valuation |
|
$3,119,000 |
$2,336,000 |
$2,824,000 |
33.5 |
10.4 |
|
Cheyenne MSA Building Permits |
|
45 |
10 |
29 |
350.0 |
55.2 |
|
|
Valuation |
|
$5,195,000 |
$1,793,000 |
$4,341,000 |
189.7 |
19.7 |
|
|
|
|
|
|
|
|
|
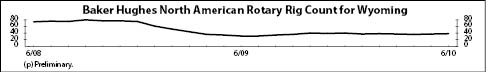
| Baker Hughes North American Rotary Rig Count for Wyoming |
|
38 |
37 |
31 |
2.7 |
22.6 |
|
|
|
|
|
|
|
|
|
|
|
|
|
|
|
|
|
|
| |
(p) Preliminary. (r) Revised. (b) Benchmarked.
(1) Local Area Unemployment Statistics Program estimates. |
| (2) Metropolitan Statistical Area. |