Employment Change and Impacts on Workplace Fatalities in Wyoming
Research spanning the 18-year period from 1992 to 2009 shows that employment changes in Wyoming are directly related to changes in the number of workplace fatalities; for example, as total employment increases or decreases, so does the number of workplace fatalities.Various statistical techniques yield similar results. One method used in this research shows that a 1% increase in employment is associated with an increase of 2.7 fatalities. Using another method produced similar results, as a 1% increase in employment was directly associated with an increase of 2.4 fatalities.
Introduction
This study examined the relationship of changes in overall employment by place of work on the number of workplace fatalities. The hypothesis is that greater exposure (number of people employed, total hours worked, hours worked per person, etc.) is associated with the number of fatalities. By analogy, as the amount of traffic through an intersection increases, the number of potential accidents increases.
More information about workplace fatalities can be found in the article titled, "Wyoming Occupational Fatalities Drop to Record Low in 2009."
Methodology
This study examines annual fatalities from 1992-2009. Employment data 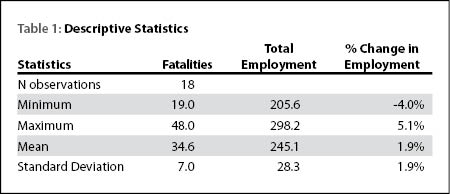 are from the Current Employment Statistics Survey (CES). The wage information is from the Quarterly Census of Employment and Wages (QCEW). Some descriptive statistics of the relevant variables are shown in Table 1. A correlation matrix was produced containing the relevant variables.
In this analysis, the concept of exposure is measured by change in employment levels and change in the average wage in Wyoming. Change in the average wage serves as a proxy for the amount of time worked by place of work. It is important to note a distinction between measuring employment by place of work (as in this analysis) and measuring employment by place of residence. These two measurements can be substantially different in Wyoming. This is due to the fact that "Wyoming's workforce is different from most states because it is comprised of a core group of residents and adds or subtracts nonresidents to maintain staffing levels." The percentage of nonresidents in the Wyoming workforce has been as high as 22.7%. (Jones, 2010).
As a demonstration, an Ordinary Least Squares (OLS) regression model is provided and explained. As this study is comprised of count data (data that is discrete and non-negative), a more appropriate modeling technique using a Poisson distribution is shown. SAS® PROC REG, PROC GENMOD and PROC COUNTREG were used in the regression analysis (SAS). Several model specifications were tested for each modeling technique.
Results
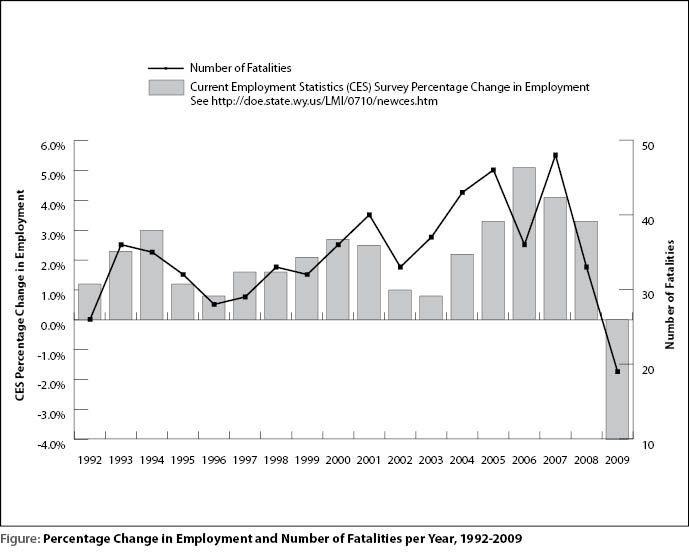
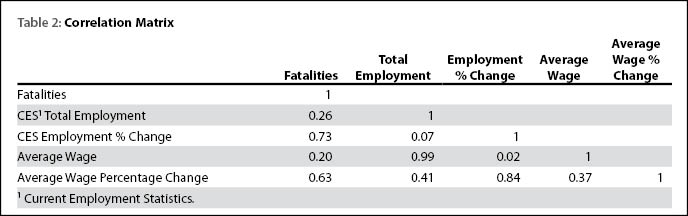
The correlation matrix shown in Table 2 indicates a strong positive ![]() relationship between the dependent variable (fatalities) and the measure of change in employment of 0.73. The Figure on page 9 demonstrates this correlation. There is also a strong relationship with the percentage change in average wages. The OLS regression results are shown in Table 3.
relationship between the dependent variable (fatalities) and the measure of change in employment of 0.73. The Figure on page 9 demonstrates this correlation. There is also a strong relationship with the percentage change in average wages. The OLS regression results are shown in Table 3. 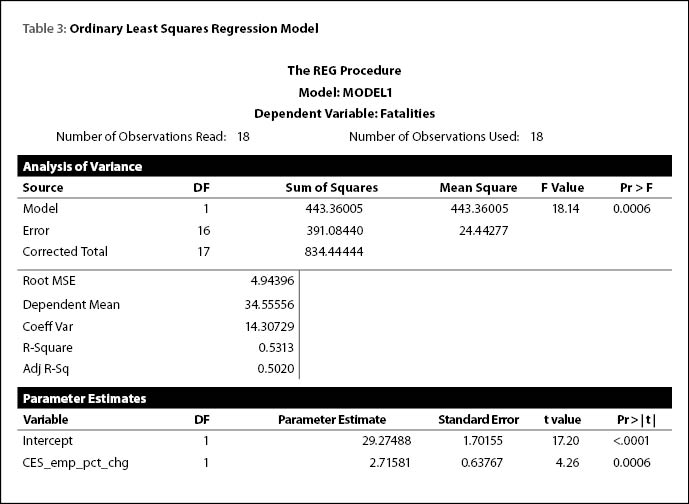 The best model was chosen by examining the R2 (a statistical measure of how well the linear regression model fits the data), the adjustedR2, and the significance of the independent variable(s). The best model contained the employment percentage change as the only independent variable. The R2 indicates that the model explains 53% of the variation in fatalities over the time period analyzed. The effect of the employment percentage change variable is highly significant. The parameter estimate of 2.7 indicates that a 1% increase in employment is associated with an increase of 2.7 fatalities.
The Poisson regression results are shown in Table 4. The best model was selected based on the significance of the independent variable(s) as well as two information measures - Akaike's information criterion (AIC) and Schwarz's Bayesian information criterion (SBC) - which can be used to compare  competing Poisson models. As was the case in the OLS modeling, the best Poisson model contained the CES employment percentage change as the only independent variable. The impact of the employment percentage change variable is highly significant. The impact of the parameter estimate of 0.088 is interpreted differently than the OLS model. Using the average number of fatalities across the time span of 34.6, the impact of a 1% increase in employment would be calculated as
eln(34.6) + 0.088 = 36.9, which is an increase in fatalities of 2.4.
Possible Future Research
Further research could be conducted on more granular data (i.e. quarterly or monthly data as opposed to annual data). While this data is collected, it is not currently available for analysis. The number of observations in the dataset would greatly increase (i.e. from 18 annual to 72 quarterly to 216 monthly observations), therefore allowing for the production of more precise regression models.
References
Jones, S. (2009). Wyoming workforce characteristics: Nonresident influences. Wyoming Workforce Annual Report 2009. Retrieved August 16, 2010, from http://doe.state.wy.us/LMI/annual_report_09.pdf
SAS Institute Inc. (2008). SAS/STAT 9.2 User's Guide. Cary, NC: SAS Institute Inc.