Wyoming Normalizeda Unemployment Insurance Statistics: Initial Claims
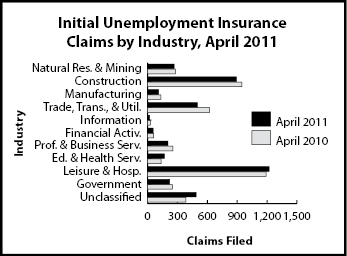
Initial claims declined by 3.3% compared to April 2010. Education and health services (24.3%) and leisure & hospitality (+2.6%) both had increased claims compared to one year ago.
| Percent Change Claims Filed | |||||
| Claims Filed | Apr_11 | Apr_11 | |||
| Apr_11 | Mar_11 | Apr_10 | Mar_11 | Apr_10 | |
| Wyoming Statewide | |||||
| Total Claims Filed | 4,229 | 3,252 | 4,375 | 30.0 | -3.3 |
| Goods-Producing | 1,270 | 1,214 | 1,359 | 4.6 | -6.5 |
| Natural Resources and Mining | 267 | 276 | 278 | -3.3 | -4.0 |
| Mining | 242 | 248 | 259 | -2.4 | -6.6 |
| Oil & Gas Extraction | 13 | 19 | 12 | -31.6 | 8.3 |
| Construction | 893 | 788 | 947 | 13.3 | -5.7 |
| Manufacturing | 110 | 150 | 134 | -26.7 | -17.9 |
| Service-Providing | 2,250 | 1,448 | 2,383 | 55.4 | -5.6 |
| Trade, Transp., and Utilities | 500 | 398 | 622 | 25.6 | -19.6 |
| Wholesale Trade | 54 | 46 | 82 | 17.4 | -34.1 |
| Retail Trade | 278 | 236 | 350 | 17.8 | -20.6 |
| Transp., Warehousing & Utils. | 168 | 116 | 190 | 44.8 | -11.6 |
| Information | 21 | 15 | 27 | 40.0 | -22.2 |
| Financial Activities | 55 | 37 | 61 | 48.6 | -9.8 |
| Prof. and Business Services | 204 | 182 | 255 | 12.1 | -20.0 |
| Educational and Health Services | 169 | 163 | 136 | 3.7 | 24.3 |
| Leisure and Hospitality | 1,222 | 579 | 1,191 | 111.1 | 2.6 |
| Other Svcs., exc. Public Admin. | 79 | 74 | 91 | 6.8 | -13.2 |
| Government | 222 | 222 | 249 | 0.0 | -10.8 |
| Federal Government | 87 | 89 | 106 | -2.2 | -17.9 |
| State Government | 27 | 23 | 25 | 17.4 | 8.0 |
| Local Government | 108 | 110 | 118 | -1.8 | -8.5 |
| Local Education | 24 | 27 | 21 | -11.1 | 14.3 |
| Unclassified | 487 | 368 | 384 | 32.3 | 26.8 |
| Laramie County | |||||
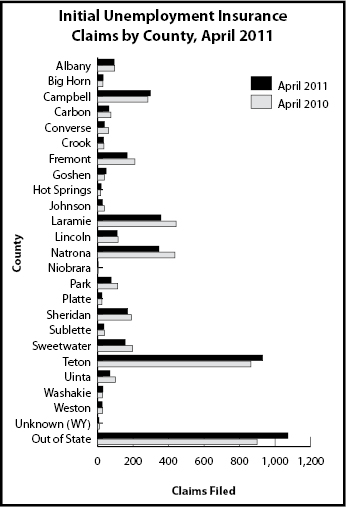
| Total Claims Filed | 355 | 365 | 441 | -2.7 | -19.5 |
| Goods-Producing | 134 | 135 | 163 | -0.7 | -17.8 |
| Construction | 122 | 113 | 143 | 8.0 | -14.7 |
| Service-Providing | 171 | 172 | 224 | -0.6 | -23.7 |
| Trade, Transp., and Utilities | 61 | 54 | 90 | 13.0 | -32.2 |
| Financial Activities | 9 | 9 | 14 | 0.0 | -35.7 |
| Prof. and Business Services | 27 | 35 | 38 | -22.9 | -28.9 |
| Educational and Health Services | 37 | 27 | 31 | 37.0 | 19.4 |
| Leisure and Hospitality | 27 | 34 | 29 | -20.6 | -6.9 |
| Government | 31 | 43 | 41 | -27.9 | -24.4 |
| Unclassified | 19 | 15 | 13 | 26.7 | 46.2 |
| Natrona County | |||||
| Total Claims Filed | 343 | 308 | 437 | 11.4 | -21.5 |
| Goods-Producing | 119 | 124 | 153 | -4.0 | -22.2 |
| Construction | 82 | 87 | 100 | -5.7 | -18.0 |
| Service-Providing | 195 | 167 | 251 | 16.8 | -22.3 |
| Trade, Transportation, and Utilities | 57 | 49 | 102 | 16.3 | -44.1 |
| Financial Activities | 6 | 6 | 10 | 0.0 | -40.0 |
| Professional and Business Services | 39 | 28 | 41 | 39.3 | -4.9 |
| Educational and Health Services | 34 | 27 | 25 | 25.9 | 36.0 |
| Leisure and Hospitality | 37 | 36 | 46 | 2.8 | -19.6 |
| Government | 13 | 8 | 21 | 62.5 | -38.1 |
| Unclassified | 16 | 9 | 12 | 77.8 | 33.3 |