Wyoming Normalizeda Unemployment Insurance Statistics: Continued Claims
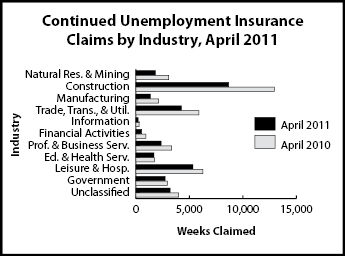
Substantial declines in over-the-year continued weeks claimed occurred in mining (-41.3%) and wholesale trade (-42.2%).
| Percent Change Weeks Claimed | |||||
| Continued Weeks Claimed | Apr_11 | Apr_11 | |||
| Apr_11 | Mar_10 | Apr_10 | Mar_11 | Apr_10 | |
| Wyoming Statewide | |||||
| Total Weeks Claimed | 32,734 | 36,765 | 44,526 | -11.0 | -26.5 |
| Extended Weeks Claimed | 17,773 | 18,698 | 26,831 | -4.9 | -33.8 |
| Total Unique Claimants* | 10,035 | 8,937 | 13,101 | 12.3 | -23.4 |
| Benefit Exhaustions | 1,138 | 1,055 | 1,530 | 7.9 | -25.6 |
| Benefit Exhaustion Rates | 11.3% | 11.8% | 11.7% | -0.5% | -0.3% |
| Goods-Producing | 11,847 | 15,156 | 18,135 | -21.8 | -34.7 |
| Natural Resources & Mining | 1,825 | 1,890 | 3,066 | -3.4 | -40.5 |
| Mining | 1,618 | 1,630 | 2,756 | -0.7 | -41.3 |
| Oil & Gas Extraction | 118 | 129 | 161 | -8.5 | -26.7 |
| Construction | 8,678 | 11,702 | 12,947 | -25.8 | -33.0 |
| Manufacturing | 1,344 | 1,564 | 2,122 | -14.1 | -36.7 |
| Service-Providing | 14,966 | 14,789 | 19,448 | 1.2 | -23.0 |
| Trade, Transp., & Utilities | 4,261 | 4,568 | 5,882 | -6.7 | -27.6 |
| Wholesale Trade | 539 | 620 | 933 | -13.1 | -42.2 |
| Retail Trade | 2,722 | 2,884 | 3,507 | -5.6 | -22.4 |
| Transp., Wareh., & Utilities | 1,000 | 1,064 | 1,442 | -6.0 | -30.7 |
| Information | 202 | 205 | 289 | -1.5 | -30.1 |
| Financial Activities | 541 | 634 | 939 | -14.7 | -42.4 |
| Prof. & Business Services | 2,360 | 3,116 | 3,339 | -24.3 | -29.3 |
| Educational & Health Services | 1,673 | 1,626 | 1,722 | 2.9 | -2.8 |
| Leisure & Hospitality | 5,327 | 3,987 | 6,271 | 33.6 | -15.1 |
| Other Svcs., ex. Public Admin. | 602 | 653 | 1,006 | -7.8 | -40.2 |
| Government | 2,729 | 3,314 | 2,937 | -17.7 | -7.1 |
| Federal Government | 1,262 | 1,618 | 1,037 | -22.0 | 21.7 |
| State Government | 258 | 281 | 337 | -8.2 | -23.4 |
| Local Government | 1,209 | 1,415 | 1,563 | -14.6 | -22.6 |
| Local Education | 213 | 249 | 325 | -14.5 | -34.5 |
| Unclassified | 3,192 | 3,506 | 4,006 | -9.0 | -20.3 |
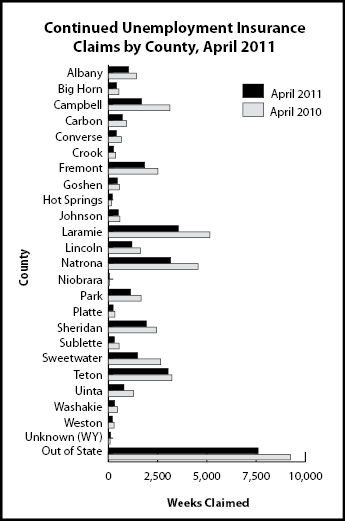
| Laramie County | |||||
| Total Weeks Claimed | 3,551 | 4,476 | 5,153 | -20.7 | -31.1 |
| Total Unique Claimants | 1,065 | 1,116 | 1,511 | -4.6 | -29.5 |
| Goods-Producing | 1,228 | 1,902 | 2,014 | -35.4 | -39.0 |
| Construction | 1,049 | 1,645 | 1,685 | -36.2 | -37.7 |
| Service-Providing | 1,824 | 2,030 | 2,544 | -10.1 | -28.3 |
| Trade, Transp., & Utilities | 599 | 665 | 974 | -9.9 | -38.5 |
| Financial Activities | 101 | 131 | 203 | -22.9 | -50.2 |
| Prof. & Business Services | 363 | 501 | 484 | -27.5 | -25.0 |
| Educational & Health Svcs. | 415 | 405 | 293 | 2.5 | 41.6 |
| Leisure and Hospitality | 247 | 226 | 369 | 9.3 | -33.1 |
| Government | 402 | 438 | 480 | -8.2 | -16.3 |
| Unclassified | 97 | 106 | 115 | -8.5 | -15.7 |
| Natrona County | |||||
| Total Weeks Claimed | 3,169 | 4,113 | 4,555 | -23.0 | -30.4 |
| Total Unique Claimants | 928 | 1,010 | 1,334 | -8.1 | -30.4 |
| Goods-Producing | 987 | 1,460 | 1,871 | -32.4 | -47.2 |
| Construction | 678 | 1,085 | 1,216 | -37.5 | -44.2 |
| Service-Providing | 1,968 | 2,376 | 2,365 | -17.2 | -16.8 |
| Trade, Transp., & Utilities | 726 | 944 | 839 | -23.1 | -13.5 |
| Financial Activities | 65 | 84 | 145 | -22.6 | -55.2 |
| Professional & Business Svcs. | 350 | 424 | 421 | -17.5 | -16.9 |
| Educational & Health Services | 305 | 322 | 370 | -5.3 | -17.6 |
| Leisure & Hospitality | 323 | 381 | 346 | -15.2 | -6.6 |
| Government | 137 | 193 | 191 | -29.0 | -28.3 |
| Unclassified | 77 | 84 | 128 | -8.3 | -39.8 |
| *Does not include claimants receiving extended benefits | |||||